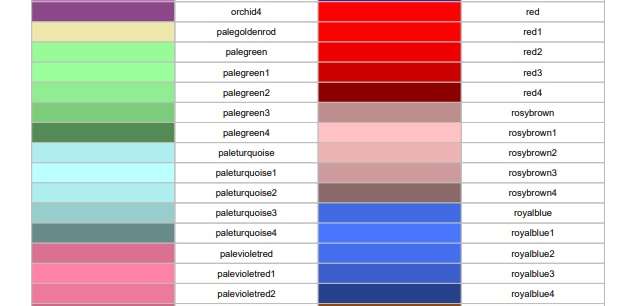
Coloring plots in R was something I always did using colors in R that are mapped to actual names. For example, Dr. Ying Wei at Columbia University developed an R color cheat sheet with named colors in R. Here is an excerpt from it.
As you can see on the cheat sheet, when you are coloring plots in R, you can call out those colors by the names listed on the cheat sheet so you do not need to use the default plot colors. As an example from the cheat sheet, if you were to set an element equal to the color “orchid4”, it would come out like the color shown on the cheat sheet.
However, as you can tell, that cheat sheet is pretty limited. What if you want to go beyond those named colors when coloring plots in R?
Coloring Plots in R: Palette Inspired by an Image
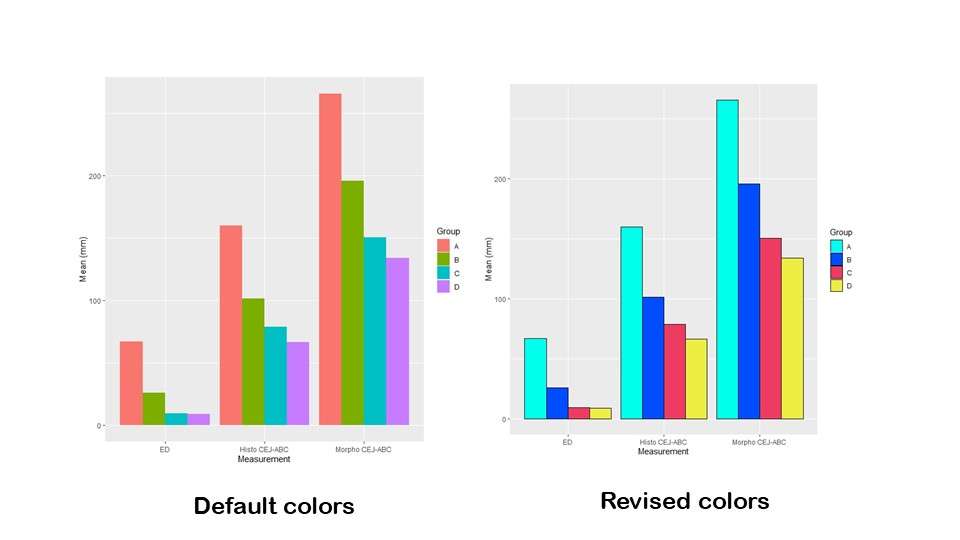
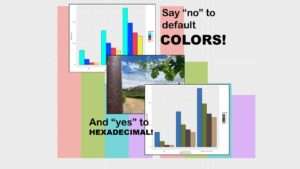
You may be aware that colors on the web are mapped to hexadecimal codes. Here is an example where I used hexadecimal codes to wake up the colors in an R plot.
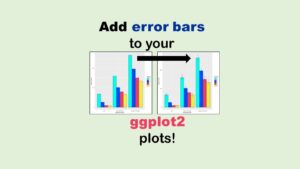
As you can see in the graphic, the original plot has four colors. Here is the code for the original plot that just uses the default colors (accessible on Github).
ggplot(metric_plot_data, aes(x=Measure, y=Mean, fill=Group)) +
	geom_bar(position=position_dodge(), stat="identity") +
	ylab("Mean (mm)") +
	xlab("Measurement")
You can see by the code that the variable “measure” is what is being listed across the x-axis (ED, Histo CEJ-ABC, and Morpho CEJ-ABC). Mean refers to the value being graphed on the y-axis, and Group refers to the grouping of the experimental units. This was the lab study, so I think they were groups of mice. Group=fill is what made R select four default colors and color the bars.
So let’s say you are coloring plots in R and want to recolor this plot. I used to always turn to a cheat sheet to pick out the number of colors I needed, but I felt that was too limiting.
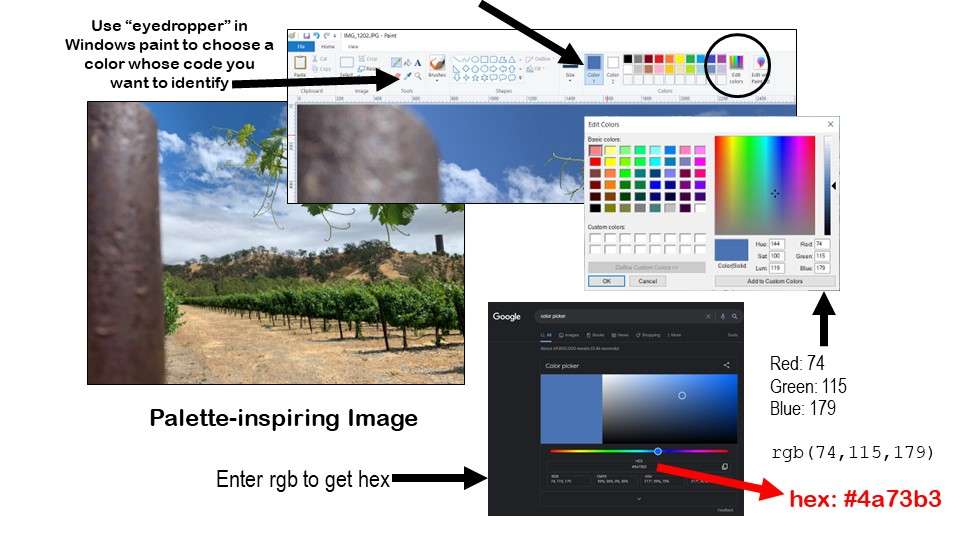
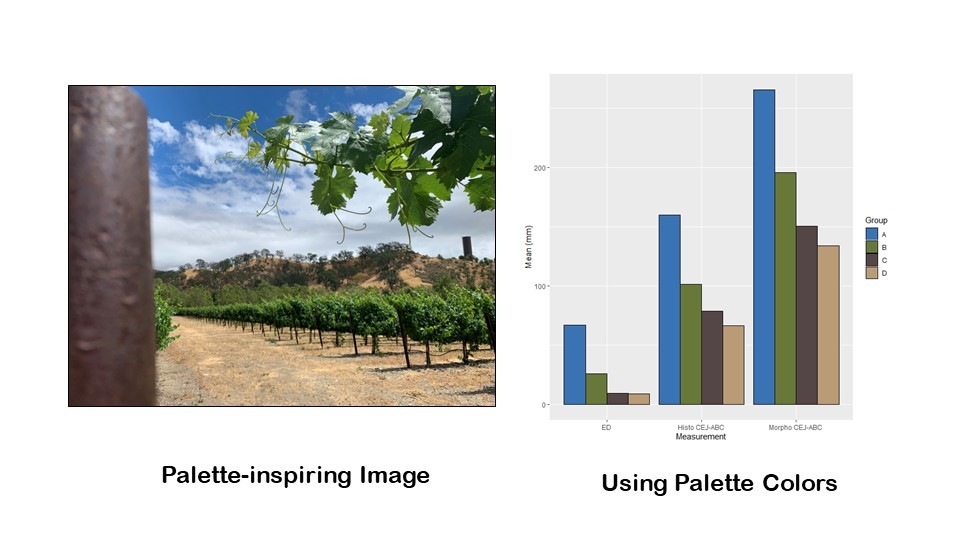
But how do you pick a set of four colors – or any size color palette – that work together very well? One way – the way I basically learned in fashion design school – is to select an image with a color scheme you like. I like to choose an image from nature. For this demonstration, I selected a photo I took when I visited Wente Vineyards in California to inspire my color palette for my four bars in my bar chart. I chose it because I figured I could get a good blue, a solid green, a nice rich dark color from the pole on the left, and a strong neutral that was different from the dark color and wasn’t too light from the ground colors. The diagram shows how I got the codes from these colors off of the image.
If you open your selected image in Windows Paint or another program where you can look at the properties of selected colors, you can find their “red, green, blue” or “rgb” code. In the diagram, I show how I opened my photograph in Windows Paint, and used the eyedropper feature to put a blue color from the sky on the Paint palette. Then, I used the “edit colors” button to identify the red, green, blue (rgb) code for that blue color, which was Red: 74, Green: 115, and Blue: 179, and is expressed rgb(74,115,179).
Next, I went to Google and searched for “color picker”, and that brought up the online color picker. I typed in the rgb code into the field and hit “enter” (see diagram) to get the hexadecimal code for that color, which was #4a73b3 (they all start with #). I proceeded to do that with all four colors, and I made the following code to remember what they were.
wente_sky <- c("#3a73b3")	#rgb(74,115,179)
wente_leaf <- c("#687839")	#rgb(104,120,57)
wente_pole <- c("#544646") 	#rgb(84,70,70)
wente_ground <- c("#b99b75")	#rgb(185,155,117)
I named them very unique names (e.g., wente_sky instead of skyblue) so they didn’t conflict with existing names from palettes as I showed you above. Next, I assembled them into a string called wente_colors using my new names.
wente_colors <- c(wente_sky, wente_leaf, wente_pole, wente_ground)
This way, I can easily troubleshoot the plot. If I don’t like how the light color – the wente_ground color looks – I know which one of these to edit. I can rearrange them in the string, choose another color and set another variable name and put that in the string to tweak the image, and so on.
Then, to add these colors in instead of the default ones, I made this revised code.
ggplot(metric_plot_data, aes(x=Measure, y=Mean, fill=Group)) +
	geom_bar(position=position_dodge(), stat="identity", color='black') +
	ylab("Mean (mm)") +
	xlab("Measurement") +
	scale_fill_manual(values=wente_colors)
To see the changes, first, look at the geom_bar line. You will see that I added color=’black’ in the call. That’s really just to add the black outline. I still am calling up fill=Group in the aes statement. Ggplot2 is sequential, so what code comes first and what code comes after that matters. Because I put the fill=Group in the aes, R is basically plotting the original default colors all the way through until the last line, which is a new one I added.
The last line, scale_fill_manual, specifies values to overwrite from the fill instructions earlier. You will see I added the argument values = wente_colors, which is the string. If R errors out on this line, a typical mistake is that you have a different amount of things to color than you have specified colors. Imagine I had only included three items in the wente_colors string. Since I have four groups and four colors, that would have caused R to error.
Here's the recolored plot – and personally, I think it looks fabulous!
Coloring Plots in R: Using a “Canned” Palette
If you are making a gorgeous white paper that is long and has a lot of plot, it probably makes sense for you to invest the time to make a palette based on an image. But for these four bars or similar use-cases, I always found it too time-consuming!
That’s why I was so happy when I discovered the web site Coolors.co which lets you shop for canned palettes! Please take a look at my video to see how I shopped for a palette in Coolors.co and came up with the colors I ultimately chose for the plot in the article.
Basically, Coolors.co offers you color bars with the hexadecimal code printed on them that you can copy to the clipboard and paste into your R code. When I made this plot, I had made another plot for another customer recently using these “cool” colors, so I just copied the string out of the previous code.
cool_colors <- c("#00FFED", "#004CFF", "#ED3B61", "#EDED44")
You will see here that I jumped over the step of naming each color, and just lined up all four hexadecimal codes as a string called cool_colors. This would not be easy to troubleshoot, but I guess I was in a hurry!
ggplot(metric_plot_data, aes(x=Measure, y=Mean, fill=Group)) +
	geom_bar(position=position_dodge(), stat="identity", color='black') +
	ylab("Mean (mm)") +
	xlab("Measurement") +
	scale_fill_manual(values=cool_colors)
As you can see, it’s the same old code, but the last line overwrites the default colors using scale_fill_manual and this time specifying our new cool_colors vector. This produces the “beach ball” colors in the plot labeled “revised colors”. Don’t forget – you can get the code on Github here.
Updated October 10, 2022. Added banner October 31, 2022. Updated banners June 16, 2023.
Read all of our data science blog posts!
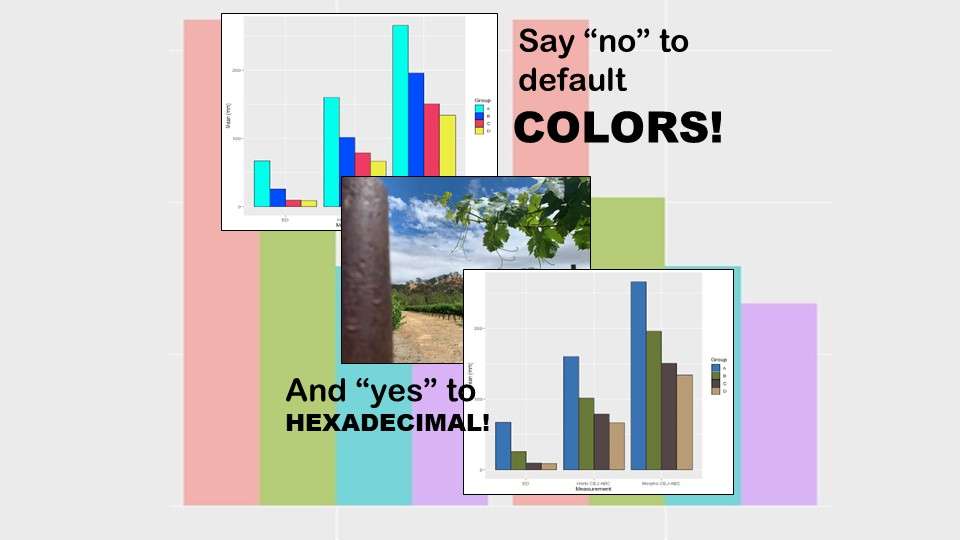
Recoloring plots in R? Want to learn how to use an image to inspire R color palettes you can use in ggplot2 plots? Read my blog post to learn how.

