Online Data Science Mentoring Program
This self-paced online mentoring program is designed specifically for individuals with domain-specific knowledge – such as experienced public health practitioners, healthcare workers, or others working in data-intensive positions in specific knowledge domains. The program will provide you a data science learning community outside of your workplace to enable you to have data science experiences so you can prepare for and get integrated into a data science team in a new career and job position. It will also provide you the ability to rebrand yourself as a data scientist through the development of an online public data science portfolio project.
Program benefits:
- Professional Personal Mentoring: One-on-one mentoring with a dedicated data science mentor to provide you personal guidance from expertise you cannot get with online courses.
- Portfolio Project: Focus on helping you make a public portfolio project to showcase your work and rebrand yourself as a data scientist.
- Exclusive Online Learning Center: Access to exclusive online courses and learning resources specifically designed for the program only available to program participants.
- Exclusive Real-time Learning Activities: One online workshop per month to teach you a new set of skills you will need to work among professional data scientists.
- Group Support: Regular online group meetings (“meetups”) with a supportive learning community so you can feel social support and get practice sharing data science results.
- Convenient Scheduling and Networking: Online scheduled and asynchronous learning activities allow you to complete your “homework” when it is convenient for you while still facilitating networking with other data scientists from all over the world.
- Self-paced: The program is self-paced and paid for by monthly subscription, so you can advance as slowly or as quickly as you like. It is a no-shame program, where we try to encourage you to do your best every month toward completing your portfolio project, and helping you remove any barriers. We use a goal plan to keep you on pace, but adjust the goal plan as your personal situation changes accordingly.
Sign up for a 30-minute Zoom call to meet Monika, data science mentor, and learn more about this program.
Set Your Goals in This Self-Paced Program
The reason the program is self-paced is that you can get through it as quickly or as slowly as you like. The self-paced program is divided into four phases you work through in order. You could take an entire year to do all four phases, or your can get them done in a few months. Every learner has a goal plan that we set up at the beginning of your program participation. That way, you can set your goals according to the pace of your own lifestyle and plans for career development. Here are some common options:
- One-year Plan: Imagine you made a goal to rebrand yourself as a data scientist in one year. To get to Phase 4 in a one-year plan, learners should expect to spend an extra 20 hours per month on mentoring program activities. This pace is ideal for someone who has family obligations or is especially active in their workplace, and cannot prioritize career development activities as often as they would like.
- Accelerated Six-month Plan: If you are in a big hurry to rebrand yourself as a data scientist and get your portfolio project done, you could set up an accelerated plan where you get through all four phases in six months. To get to Phase 4 in a six-month plan, learners should expect to spend an extra 40 hours per month on mentoring program activities. The six-month plan would be ideal for someone who is currently not employed, and wants to take time off for career development in hopes of getting a better job. It is also ideal for someone who is in a master’s or doctoral program who is NOT attending classes, but is just taking thesis or dissertation credits.
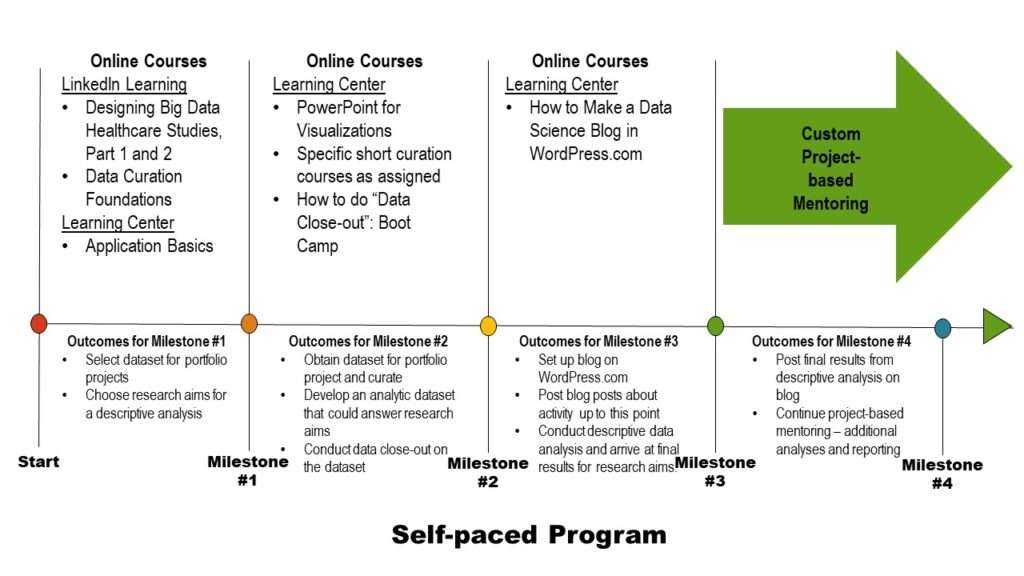
Below is a diagram of the self-paced data science rebrand mentoring program.
Phases At a Glance
Phase 1: Select a dataset for your portfolio project, and plan your analysis.
Phase 2: Develop your analytic dataset and conduct your analysis.
Phase 3: Learn about data communication and prepare for blog posts.
Phase 4: Post on your blog, put your code on GitHub, and congratulations! Your portfolio project is done – but you can continue in the program if you want to continue to build it out, and do more analytic projects.
Description of Program Phases
In this program, you will start by selecting a source dataset or datasets, and a descriptive research aim. At that point, you will have completed Phase 1, and be ready to move on to Phase 2.
During Phase 2, you will design, develop, curate and close-out an analytic dataset designed to answer this aim. After that, you will be ready for Phase 3, where you will proceed to analyze this analytic dataset to answer the research aim.
All of this will culminate in Phase 4, where you develop a data science blog on WordPress.com, and post your curation/close-out files as well as your research results on your blog so you can share your project with the data science community.
At that point, you will have completed Phase 4. If there is still time left for your participation in the program, we can continue further. We conduct more descriptive analyses with the same analytic dataset, or we can develop a regression or more complex analysis. Whatever you choose to do, you can continue posting your progress on your data science blog.
Below is a description of the framework for each phase.
Phase 1: Choosing a Dataset and Research Aim
To start Phase 1, you will need to take a few online courses.
Study Design: You will need to learn how to develop a descriptive research aim for an existing dataset. You will learn this by taking these LinkedIn Learning courses in Designing Big Data Healthcare Studies (part 1 and part 2). They cover epidemiologic approaches to using secondary data in analyses.
Part 1 is 2 hours and 15 minutes, and Part 2 is 1 hour and 35 minutes. You will be awarded an online certificate for each one you complete.
Data Curation: Data curation skills are needed to document the datasets you will use during your participation in the program. To gain basic data curation skills, take this LinkedIn Learning course, “Data Curation Foundations” (5 hours). This course provides you specific skills in using Microsoft Word, PowerPoint, and Excel. You will be awarded an online certificate when you complete this course.
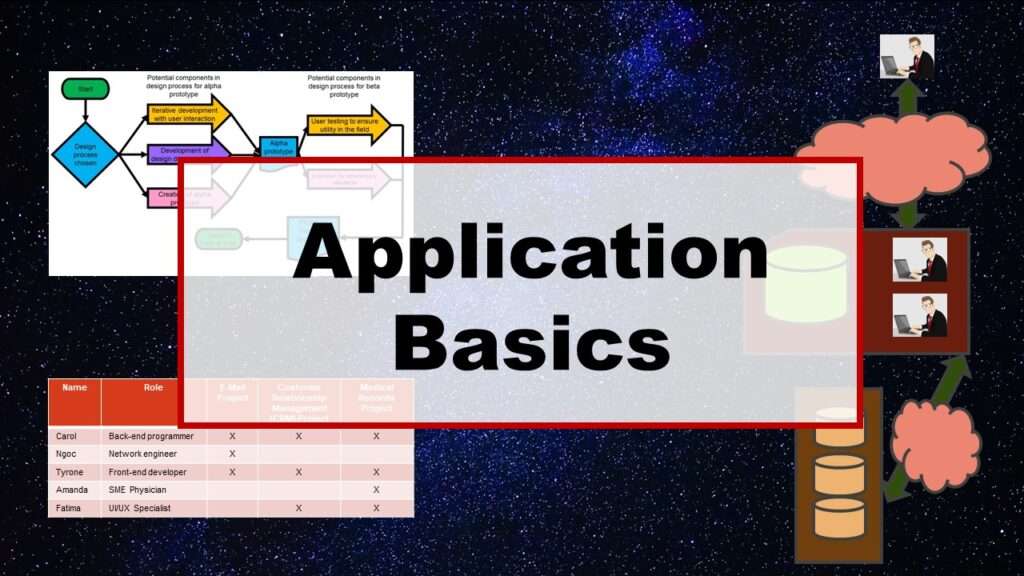
Application Basics: A lot of data that data scientists analyze come out of various types of applications. However, we don’t learn much about data that come from applications in when we go to college and study public health and healthcare. Included in your mentor program participation is access to this custom program learning center course, “Application Basics” which will provide you the necessary background and terminology if you want to use a dataset that originates in an application for your project.
The course includes six hours of course activities, including three challenges, three chapter quizzes, and a final exam. You will be awarded an online certificate when you complete this course.
Once you have all this background, you will be ready to visit our curated datasets page and select a dataset to use for your portfolio project. Need ideas? Check out this blog post where I provide three examples of ideas you could do for a portfolio project. You will also be able to choose a descriptive research aim to guide your analysis.
Phase 2: Preparing and Closing out an Analytic Dataset
By now, you will have obtained your source datasets, and will need to operationalize the variables so you can create an analytic dataset to answer your descriptive research aim. In order for you to be able to communicate with other program participants and your data science mentor, you will need gain advanced data curation skills.
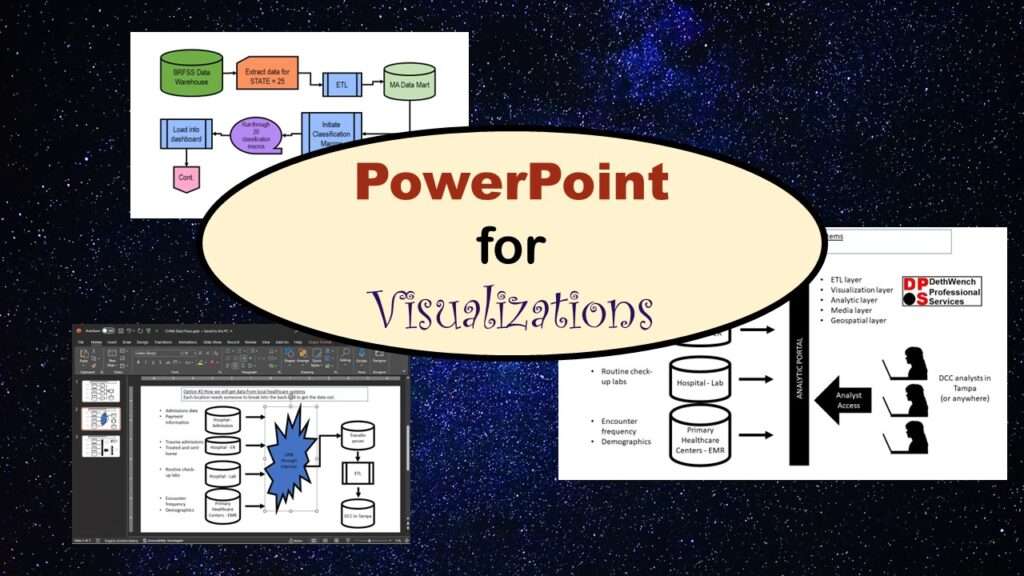
A lot of data curation is done with visualizations, and the easiest tool for this is Microsoft PowerPoint. Therefore, the focus of the program-specific learning center resources have to do with using PowerPoint to do advanced data curation.
PowerPoint for Visualizations Course plus Short Curation Courses as Assigned: The “PowerPoint for Visualizations” course teaches how to use specific PowerPoint features that are particularly useful to leverage for visualizations and data curation files. You will be awarded an online certificate when you complete this course.
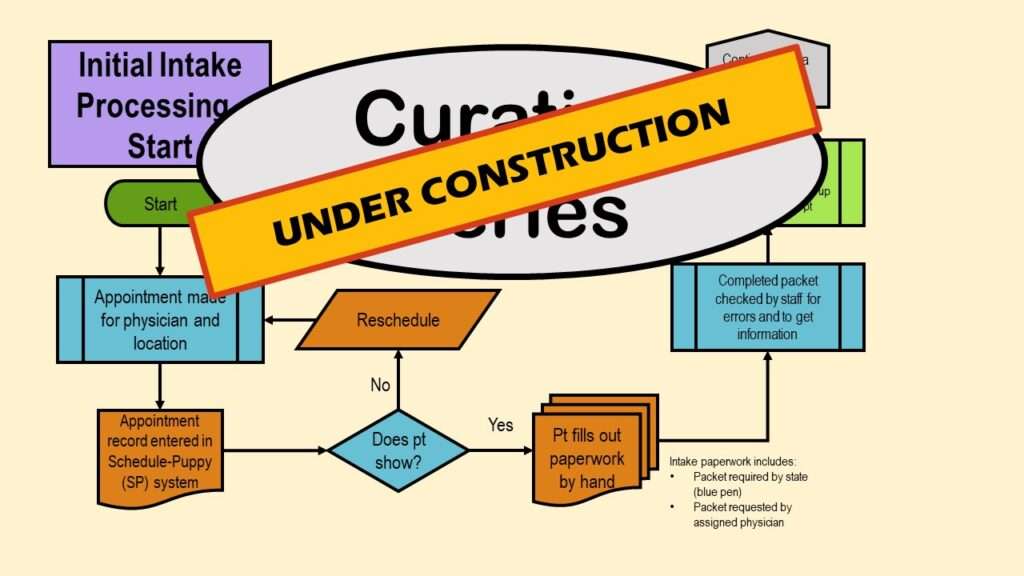
After the program participant completes this foundation course, their data science mentor will assign different curation short courses depending upon their specific portfolio project. The short courses will consist of a didactic portion followed by a challenge and assessment. Each short course will award its own online certificate.
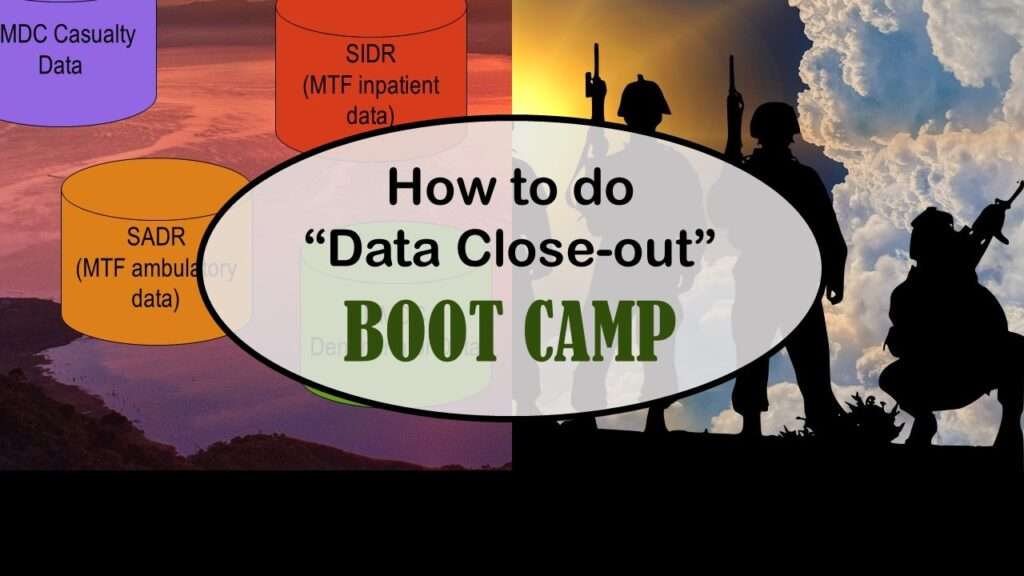
How to do “Data Close-Out” Boot Camp: This is a comprehensive course on how to close-out and serve up datasets from research studies. You will be doing a miniature version of this in the mentoring program with your analytic dataset.
This course is an intense boot camp. It includes 3 hours of video content, 9-10 hours of course activities with quizzes, 7 case studies, and 5 challenges and solutions. It builds upon the data curation foundation you already have by this point in the program, and provides advanced guidance on how to document and serve up research datasets. You will be awarded an online certificate when you complete this boot camp course.
Phase 3: Answering Your Research Aim and Setting Up Your Blog
In Phase 3, you will work behind the scenes to develop the statistical code, data, tables, figures, and other files to answer your research aim. You will also learn how to use WordPress.com and set up a data science blog.
How to Make a Data Science Blog in WordPress.com: This course, which is custom-designed for program participants and is part of our learning center, shows an example of setting up a WordPress.com blog to showcase a data science portfolio project. It provides you the knowledge and skills to develop blog posts to showcase your curation/close-out files and the results of our analysis which you will post in Phase 4. You will be awarded an online certificate when you complete this course.
Phase 4: Posting on Your WordPress.Com Blog
At the start of Phase 4, you should have two sets of offline files: data curation/close-out files from developing your analytic dataset, and results files from answering your research aim. Your data science mentor will guide you to posting these deliverables in posts on your WordPress.com blog (following the example from the course you took in Phase 3).
Beyond Phase 4: Custom Mentoring
Once you complete some posts on your data science blog to showcase your curation and your research aim results, you can propose unique research questions, answer them, and post the results on your blog.
- The reason why a descriptive analysis is assigned as the first step of the program is so that you can get to know a dataset well and answer a simple research question to start.
- Once you have posed a descriptive research question, curated an analytic dataset, and answered it, you now have an intimate knowledge of the data.
Pain Point: We Need More Competent Healthcare Data Scientists!
These days, there are many public health jobs available all over the world, but let’s face it – they don’t pay very well. Also, they tend to be very demanding. They require long hours of work, and very specific skills and training. However, in the end, they are not very prestigious, and the salaries are not that high.
Back in 2011, when I left my public health job at the US Army, I was also feeling frustrated with the pace of my work. I felt like management had been terrible at most of my public health jobs, and therefore, we were unable to get much work done. So even though I had gone into this field not to make money, but to do good – I really wasn’t getting much good done.
Whether you are new to public health – just graduating with a doctorate or a master’s degree – or you are like me, and have been in the field awhile, you can see the writing on the wall. With the pandemic and all the other problems with health and healthcare it exposed, these public health jobs have now become very abundant – but they are literally no fun. With the anti-mask and other anti-vaccine sentiments out there, some public health jobs now are downright dangerous.
Are you in Public Health? Consider a Rebrand to Data Science!
What does it mean to do a public health rebrand to data science? What it means is that if you are a public health practitioner, you are already way ahead of the programmers and engineers in the data science field in some ways – specifically, when it comes to health domain knowledge, and knowledge of research methods and statistics. But as you probably realize, you are way behind them in other ways. Programmers and engineers use different terminology for the same things we talk about in public health. Their terminology tends to come from business and management – topics we really do not formally study in public health. So there is the issue of translating our research knowledge to a different domain.
But there is also a big culture difference. From 2002 to 2003 and then again from 2004 to 2008, I worked in an IT department. The vibe of the IT department is exactly the vibe of the data science field – spontaneous, informal, innovative, improvising, creative, non-hierarchical, and energetic. On the other hand, public health has a totally different vibe – deliberate, calculated, formal, structured, hierarchical, historical, academic – and above all, ponderous and slow. Just compare any SAS webinar (aimed at public health practitioners) to webinars for software aimed at other data scientists, and you can see the culture difference.
So even if a public health practitioner can blow away a typical data scientist with her research and statistics skills, it can be very daunting – even scary – for such a person to try to integrate herself for the first time into a data science team.
Want to Find out if the Data Scientist Rebrand Program is Right for You?
If you schedule a 30-minute Zoom meeting with me, I will go over the program with you, and ask you questions about your opinion about the program. This will help determine if the data scientist rebrand program is right for you.
Last updated June 7, 2023. Added link to portfolio project example post on July 13, 2023. Added PowerPoint for Data Visualizations July 22, 2023. Added services slider September 4, 2023. Updated wording and images on January 16, 2024.
Learn about our different free and paid services!
Learn about our online data science group mentoring program, and find out if it is right for you!

