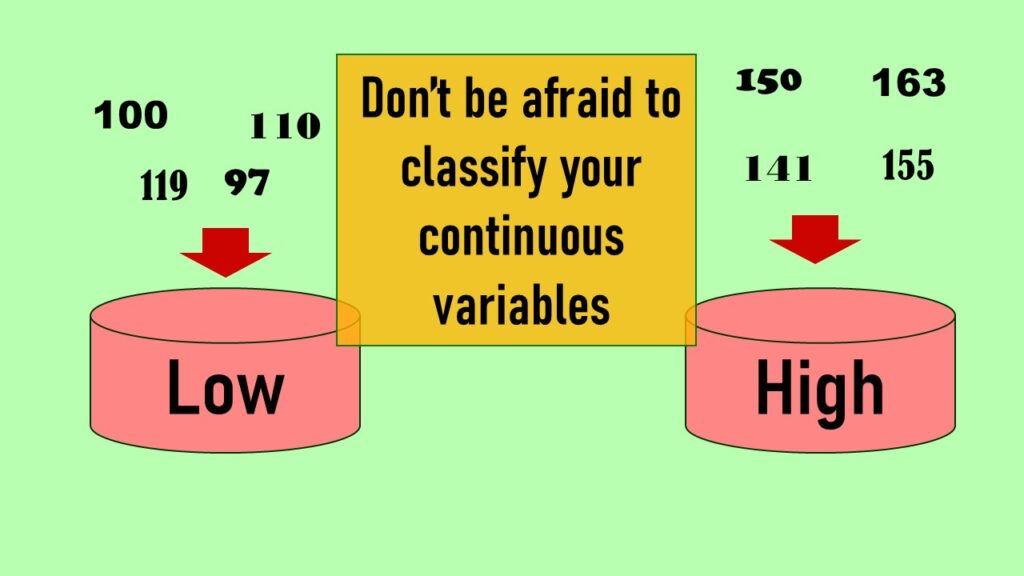
Continuous variable categorized can open up a world of possibilities for analysis. Read about it on my blog!
Tag Archives: Statistics

13
Jul
Jul
Portfolio project examples are sometimes needed for newbies in data science who are looking to complete independent projects. This blog post provides some great examples of independent projects you can do with datasets available online!
03
Apr
Apr
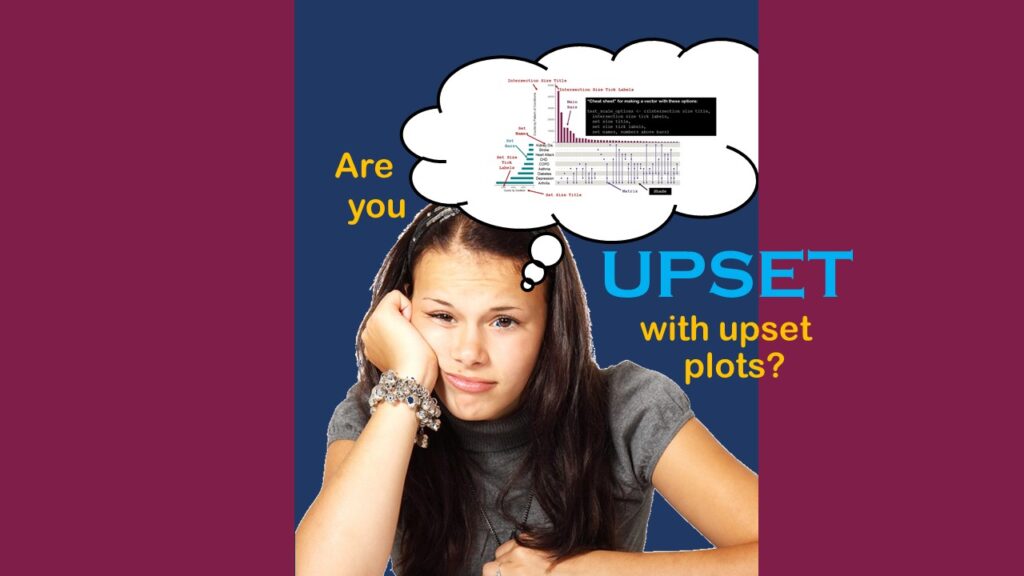
Making upset plots with R package UpSetR is an easy way to visualize patterns of attributes in your data. My blog post demonstrates making patterns of co-morbidities in health survey respondents from the BRFSS, and walks you through setting text and color options in the code.

16
Mar
Mar
Can you name categories other than “food” and “drugs” that are regulated by the FDA in the US? Read this blog post to learn what they are, and what the FDA does in the US.
16
Feb
Feb
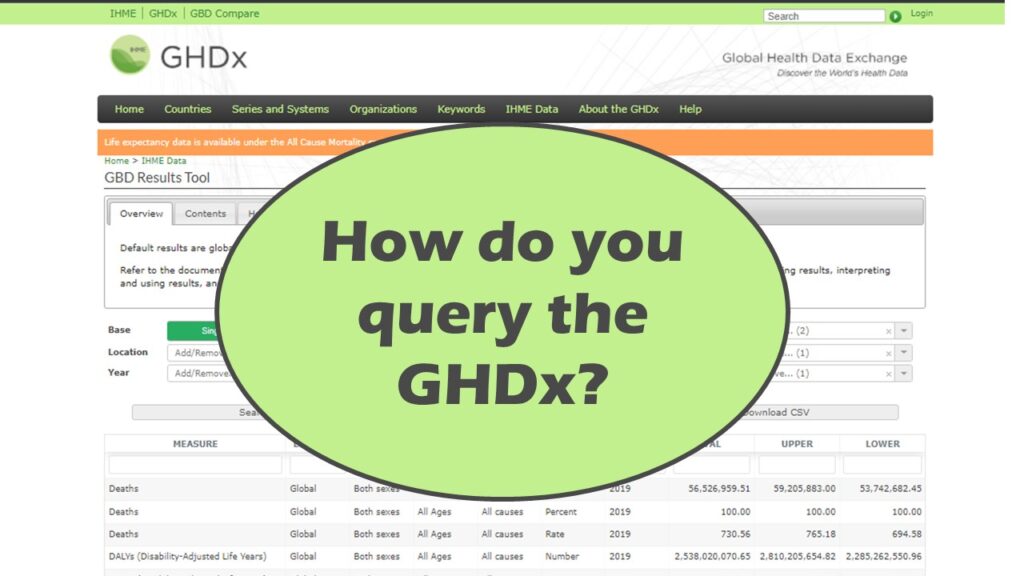
Querying the GHDx database is challenging because of its difficult user interface, but mastering it will allow you to access country-level health data for comparisons! See my demonstration!
04
Feb
Feb
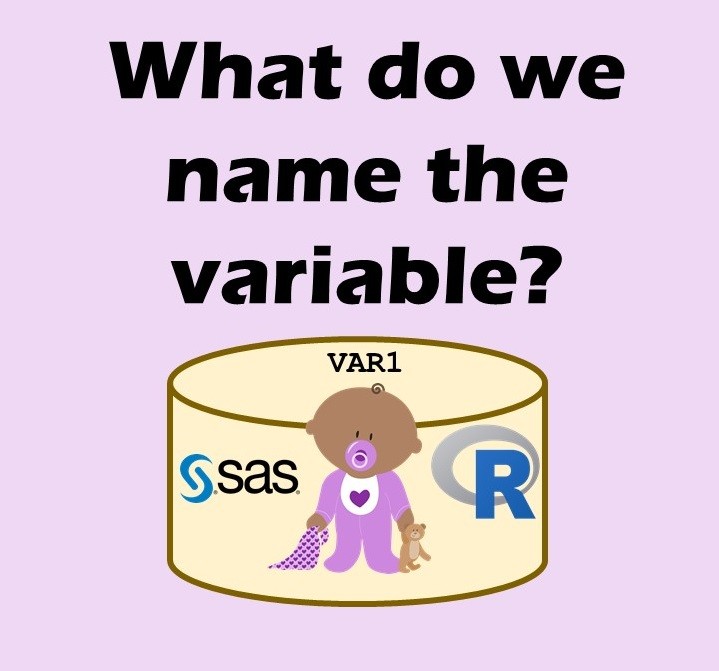
Variable names in SAS and R are subject to different “rules and regulations”, and these can be leveraged to your advantage, as I describe in this blog post.
Data Science
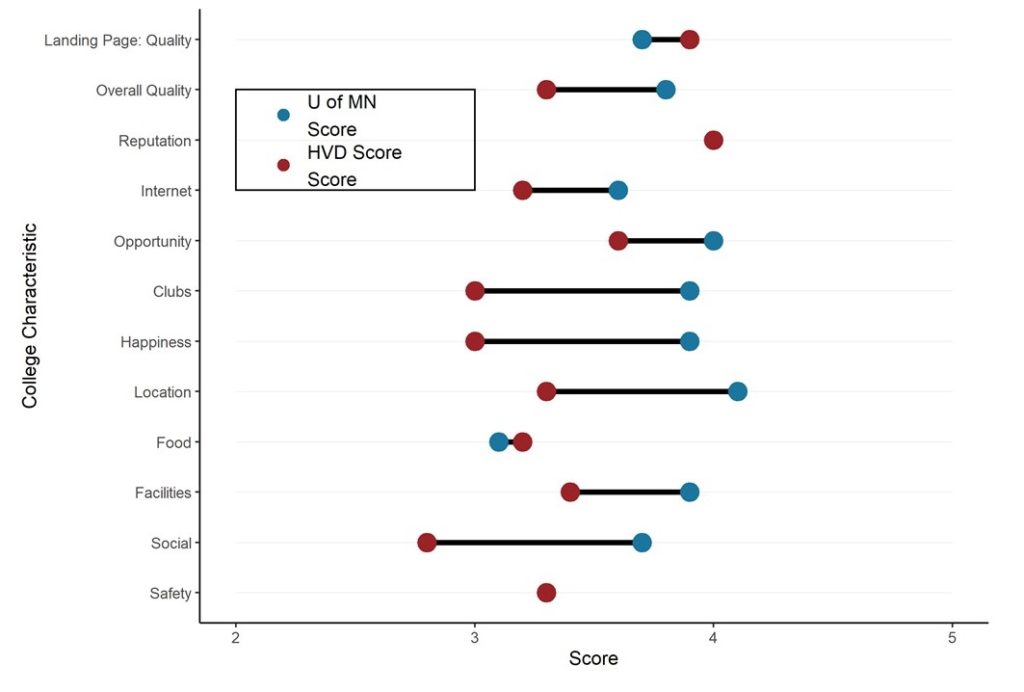
Dumbbell Plot for Comparison of Rated Items: Which is Rated More Highly – Harvard or the U of MN?
20
Sep
Sep
Want to compare multiple rankings on two competing items – like hotels, restaurants, or colleges? I show you an example of using a dumbbell plot for comparison in R with the ggalt package for this exact use-case!

05
Aug
Aug
My answer to, “What is the DHHS?” is, “A failed department”, but it is important to examined exactly what they have failed at, and how.
30
Jul
Jul
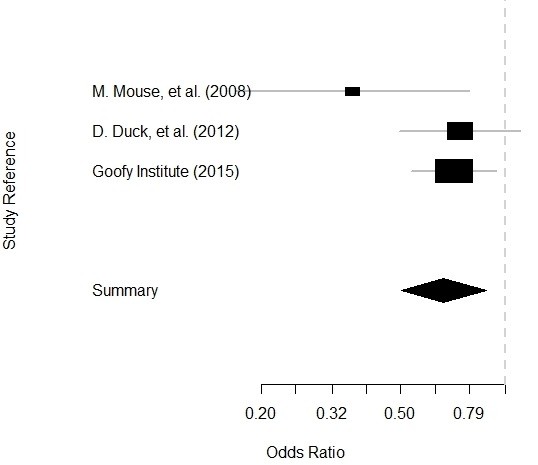
Getting data for meta-analysis together can be challenging, so I walk you through the simple steps I take, starting with the scientific literature, and ending with a gorgeous and evidence-based Forrest plot!
29
Jul
Jul
The United States (US) Center for Disease Control and Prevention (CDC) was in the spotlight during the COVID-19 pandemic. But as I describe in this blog post, it is only as good as its director.