Wondering what the Plan-Do-Study-Act (PDSA) Model is, and if you should adopt it for quality improvement in healthcare? Read my series of blog posts on the subject for my personal experience and recommendations
Tag Archives: Statistics
15
Dec
Dec
We experience artificial intelligence all the time on the internet in terms of friend suggestions on social media, internet ads that reflect what we have been searching for, and “smart” recommendations from online stores. But the reality is that even the people who build those formulas cannot usually explain why you were shown a certain […]
Career Development
Two Takeaways from Danny Ma’s Machine Learning Panel: Understanding the Problem, and Understanding your Data

04
Dec
Dec
This lively panel discussed many topics around designing and implementing machine learning pipelines. Two main issues were identified. The first is that you really have to take some time to do exploratory research and define the problem. The second is that you need to also understand the business rules and context behind the data.
26
Nov
Nov
Get to know three of my favorite SAS documentation pages: the one with sort order, the one that lists all the SAS formats, and the one that explains all the SAS operators and expressions!
Educational Resources
If You Want to Increase Conversions, Try my A/B Testing Course on LinkedIn Learning

26
Oct
Oct
A/B testing seems straightforward, but there are a lot of picky details. What A and B conditions do you actually test? How long do you run the test? How do you calculate the statistics for the test? Answer your questions by taking this LinkedIn Learning course.
20
Oct
Oct
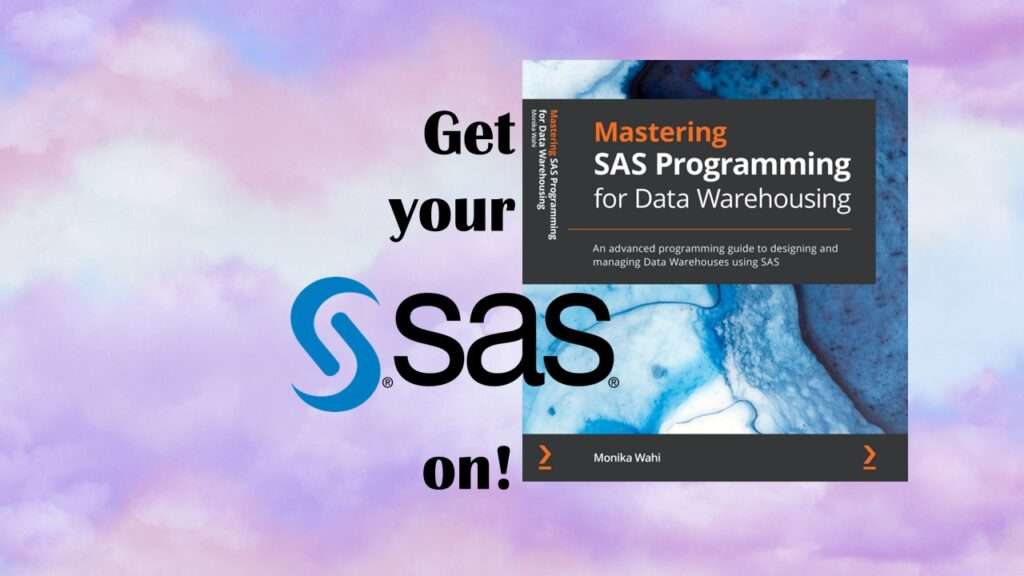
SAS is known for big data and data warehousing, but how do you actually design and build a SAS data warehouse or data lake? What datasets do you include? How do you transform them? How do you serve warehouse users? How do you manage your developers? This book has your answers!
14
Mar
Mar
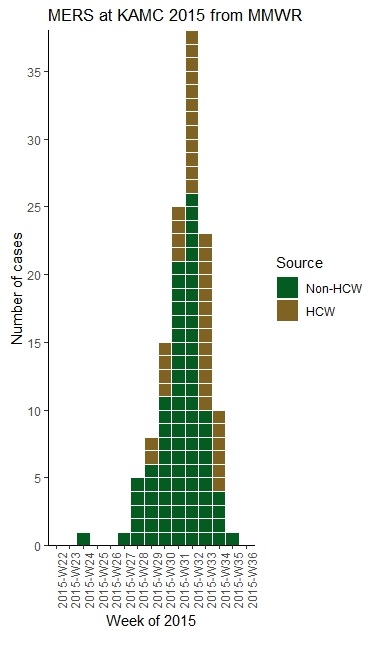
With all this talk about “flattening the curve” of the coronavirus, I thought I would get into the weeds about what curve we are talking about when we say that. We are talking about what’s called an epidemiologic curve, or epicurve for short. And to demonstrate what an epicurve is and what it means, I […]
Career Development
Physical College Classrooms are so Yesterday. Why Are We Still Studying Deeper Learning in Face-to-Face Settings?

17
Feb
Feb
My colleague who is a professor at Fitchburg State University studies deeper learning in face-to-face and online approaches in higher education. The idea is that if educators use deeper learning approaches, the students will learn more efficiently. Others have talked to me about deeper learning, and when I looked into it, I found that the […]