
On December 3, 2020, Danny Ma held a machine learning panel discussion on pipelines, and where to get started. I attended, and the chat was lively! The panelists indulged the audience, and fielded questions about development, DevOps, operations, and continuous integration/continuous delivery (CI/CD), and clarified that these are actually “pieces” of the pipeline. Depending on your use case, it can be quite a pipeline!

Many ideas were examined – perhaps my favorite being the conceptualization of the machine learning pipe as somewhat like Nintendo’s Mario, who goes down one pipe and resurfaces through another – and sometimes even gets a mushroom!
But there are two takeaways from the machine learning panel discussion that I can speak to directly – and those are:
- Understanding the problem: Having the required vision to really understand the problem that the machine learning pipeline is being design to solve, and
- Understanding the data: Really gaining some subject matter expertise on your data and context.
Machine Learning Panel’s Take on Understanding the Problem
The discussion went around the block a few times until someone pointed out that you really need to understand the problem you are trying to solve with your machine learning model, not to mention your pipeline, before you set anything up. You may have a general idea of what you are trying to do, but you need a detailed idea, because your goal is to make a machine learning model that “beats” whatever the organization is doing right now, and implement that. Even if you beat it by just a little, you can gain a lot of efficiency if we are talking about something like high volume transactions. But what is “a little”, and what exactly are you trying to beat, and how bad is what you are trying to beat now, and so on?
Not having a clear objective of what exact problem you are trying to solve with your technology thing is a big, fat, expensive problem permeating throughout the field of data science.

So, one thing that came out of this machine learning panel is that this is the kind of research you have to do to develop and tune your model in the first place, long before you incorporate it into some sort of pipeline – or tweak the existing pipeline to get your new model in there. Then you have to monitor the model’s performance so it doesn’t drift into unauthorized territory, so again, you really have to know exactly what you are trying to do, and if you are actually doing it.
In my two-part series of LinkedIn Learning courses, “Designing Big Data Healthcare Studies”, I equip you with the tools to do that very thing. The courses have the word “healthcare” in the title because that is the subject matter focus of the courses, and I teach epidemiological approaches and terms. But to be honest, you don’t have to know anything about healthcare to understand the course, because I use this layperson-intuitive health survey dataset called the BRFSS to demonstrate.

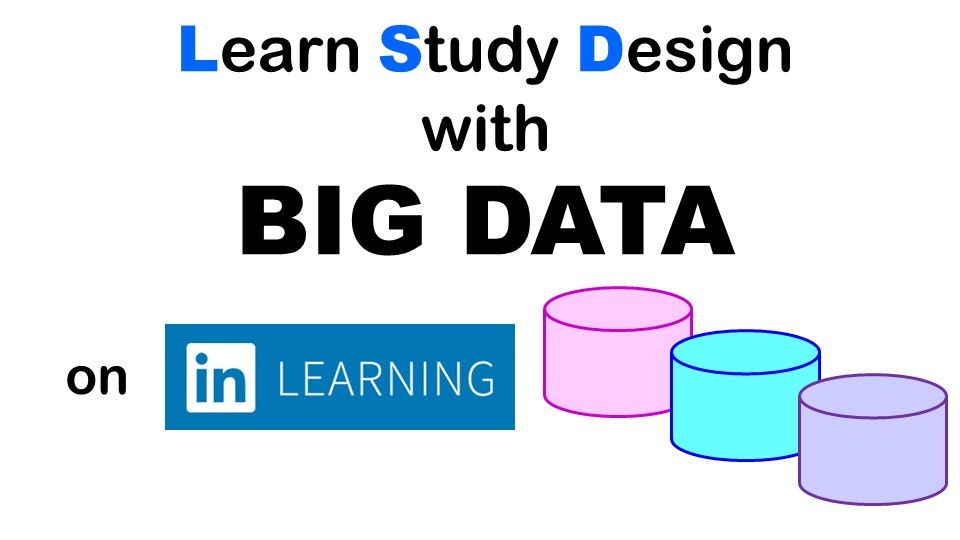
Learn how to design studies using big data.
Get training in how to get to know your data, then design studies that will give you insightful results.
Go to Course!
Machine Learning Panel’s Take on Understanding the Data
That was another main thing the machine learning panel pointed out: In order to really understand your model and the pipeline you are building, you pretty much have to totally understand the data. This is because it is very easy to make pretty sizable mistakes if you don’t understand your data well enough.
This is not something I think about as an epidemiologist a lot. When we make mistakes, we screw up public policy and kill thousands of people. But when machine learning designers make mistakes, they screw up business operations, and who knows what happens? I guess people can get killed, but another thing is businesses definitely gets in trouble in many ways.
If you are new in your career, I can’t say this with a sterner voice: You must be very careful you do not end up being written up as a “case study” in machine learning fiascos. To be fair, as new epidemiologist, I was taught at the University of Minnesota that I don’t want to be responsible for zillions of deaths just because I coded an outcome as 1,0 rather than 0,1 and flipped all the odds ratios by accident. So how do you prevent such a bad outcome? Answer: Data curation!
When I mentioned the value of data curation on the machine learning panel, the panel agreed. I have a long history of using data curation as a solution. I started really curating data like crazy when I was working at a health insurance in the early 2000s. This is because I was on a bigger team of developers and analysts, we had a pile of confusing data, and we had many vulnerable insurance members who we could theoretically maim and kill. We served a Medicaid clientele, but we workers ourselves were on the insurance, so I definitely didn’t want to make a fatal mistake!
I found the hardest thing about data curation was trying to explain what it was, and how to do it. The files I made came out looking visually simplistic, but what went into the design and execution was quite complex – kind of like designing and putting together an IKEA bookcase. I didn’t even know what “data curation” was called, so that was another definite barrier.
I began bringing these curation files – diagrams, data dictionaries, flow charts – to our meetings, and I was getting popular! It was kind of like bringing food to meetings!
Our project manager specifically befriended me on purpose because of this. And it really helped us navigate through the project we were on. The machine learning panel talked about ways to make sure you understand your data, and taking notes about it in the form of curation files is one surefire way.
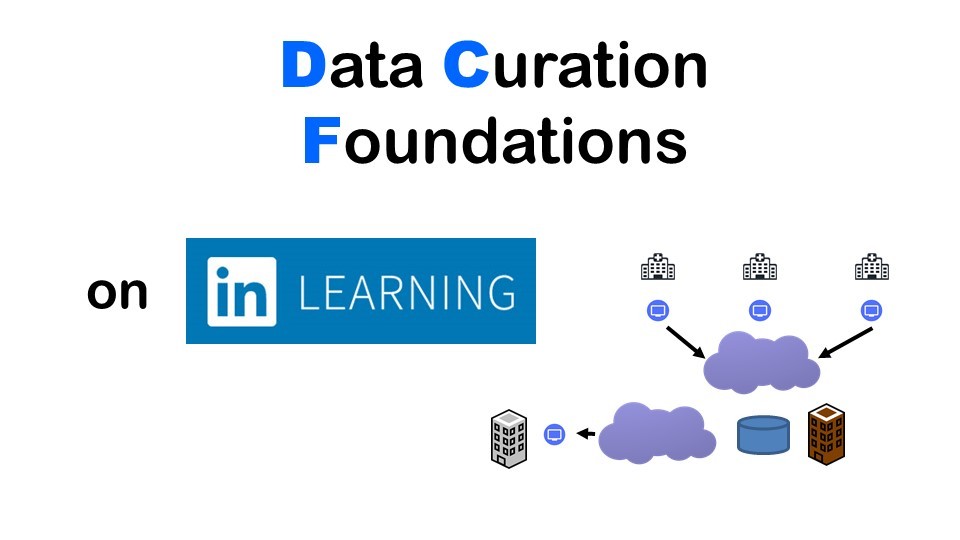
Prevent the potential annihilation of your machine learning reputation!
Take my data curation course on LinkedIn Learning, and turn your trepidation into celebration!
Go to Course!This lively panel discussed many topics around designing and implementing machine learning pipelines. Two main issues were identified. The first is that you really have to take some time to do exploratory research and define the problem. The second is that you need to also understand the business rules and context behind the data.