AI careers are now in the spotlight, as it seems like every organization has been bitten by the AI bug. We have always had predictive statistical models, but now, the hype is around using a technique called machine learning (ML) to develop artificial intelligence (AI) algorithms that outperform traditional statistical models in terms of accuracy.
Admittedly, it has been possible do ML and AI for about a decade, but only recently has it become possible to do them fast. ChatGPT is an example of a chatbot that uses AI that is pretty fast. So now, it is possible to be among a group of exclusive professionals planning for entire AI careers.
Anyone paying attention has probably noticed that AI looks like a fad – kind of like Air B-n-B. I remember when Air B-n-B started. People liked the idea of staying in other peoples’ houses, because that’s what the Air B-n-B platform offers. Personally, I did not like the idea. I like going to real bed and breakfasts – especially in Minnesota, where I’m from. It’s very hard for bed and breakfast owners to operate such a business. It’s a labor of love done by professionals. So paying to have some amateur experience using the Air B-n-B platform to find the amateurs held no appeal for me.
AI doesn’t hold a huge appeal for me either, but like Air B-n-B when it launched, it’s experiencing quite a bit of hype. So as a data scientist (and mentor), I thought I’d try to give my audience some solid advice on building AI careers that will age well, even if the hype around AI doesn’t.
AI Platforms Used by Those with AI Careers
First, if you are going to have an AI career, you will probably find yourself using an AI platform. An AI platform is software that helps you develop an AI model (that you can later add to an application pipeline).
Amazon Web Services (AWS) is a popular commercial AI development platform that has several different user interfaces (UIs). To get an idea of what an AWS UI looks like, I went to this web page, which has some screen shots and annotations about SageMaker Studio, one of the AWS UIs.
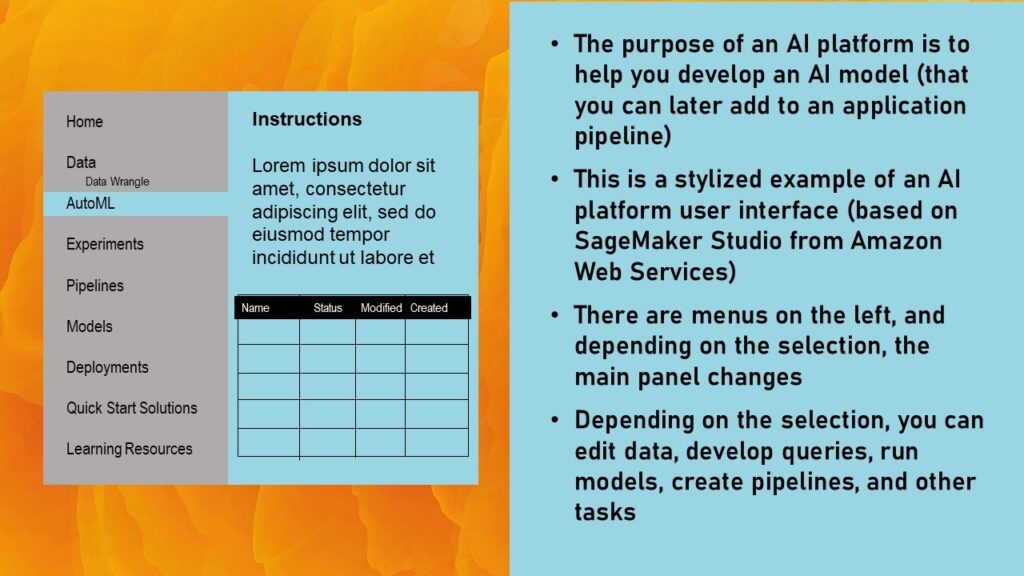
As you can see on the graphic, there is a menu on the left, and depending upon your selection, you can see different tasks you can do on the right in the main panel. If in SageMaker Studio, you click on the “AutoML” menu, in the main panel, it will give you a list of files (assumably ML files that you developed and saved on the platform).
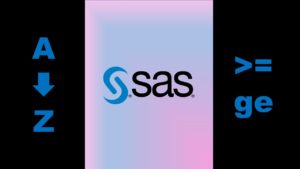
If you click on other menu items, you wills see different items or functions you can do in the main panel. Here is a diagram I made of SAS Viya, which is another platform you can use for both statistics and AI.
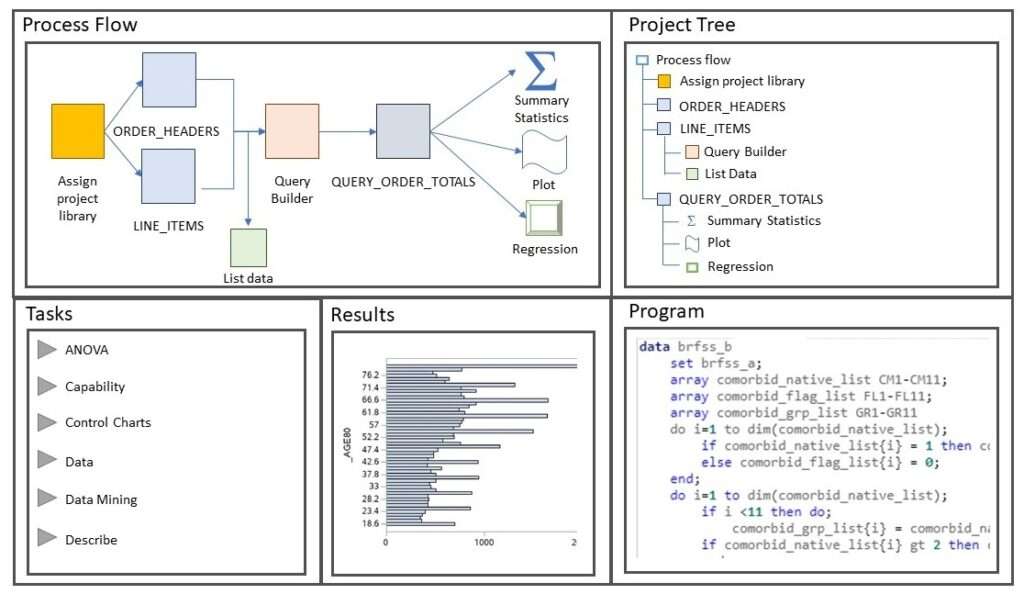
As you will see in the SAS Viya diagram, there are many different functions that can be done in different windows, such as file management, as well as pipeline creation and query management. If you embark on an AI career, get used to using these AI platforms!
The AI Bubble Impacts AI Careers
Obviously, we have a lot of different AI platforms now that people who want to have AI careers can try to learn. But how do we ride this bubble effectively and efficiently, and come out ahead when it’s over? Again, Air B-n-B provides an instructive case study. I made a diagram to illustrate my point.
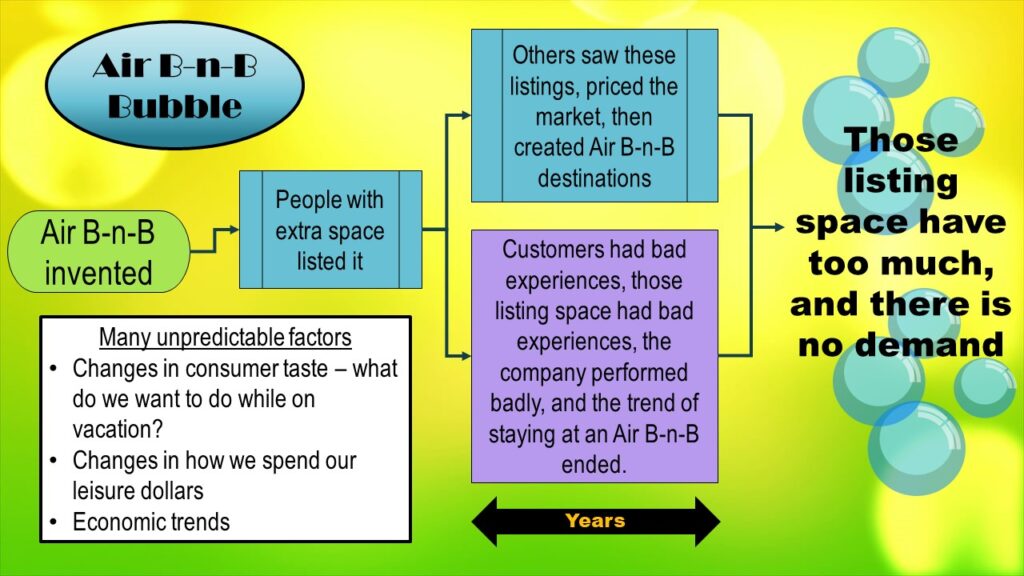
As you can see in the diagram, it starts at the left side – when Air B-n-B was invented. When it was first invented, people who had extra space rented it out. I have a professor friend in Tampa, and her house has a guest house on the property. She is a very hospitable person! She would make a great bed and breakfast owner if she wasn’t already a professor.
So I imagine someone like my professor friend could benefit from renting out her guest house if she was in the mood for the hassle of being a proprietress. She is an example of an “early adopter” persona for individuals putting up listings on Air B-n-B initially.
Now, we will move right across the diagram – to the boxes above the double-arrow labeled “years”. As you can see, over the years, two main things occurred – the blue box, and the purple box.
Let’s start with the blue box. The blue box represents the market adjusting to Air B-n-B being in it. Real estate experts in a place like Tampa – a tourist destination – probably saw listings from people like my professor friend, and formed a business plan around it. They bought up locations just to list them on Air B-n-B and essentially get into the “bed and breakfast” business.
Now let’s look at the purple box. This represents all the other changes that were happening simultaneously around this market. Air B-n-B did not handle the evolution of their business well. They made policies that caused both vacationers as well as those listing properties to have bad experiences with their app. This gave Air B-n-B a bad reputation, so it started performing badly as a business, and investors started being dissatisfied.
Also, notice the white box in the lower left. This represents some background trends. Consumer taste changed over these years. The taste for bed-and-breakfast-like experiences fell out of favor. Now people are onto doing different things with their vacations – like charity work. And people vacation less in general when the economy goes down, so there are background trends that will always exert their forces and are unpredictable.
In the end, on the right side of the graphic, we see that the problem with Air B-n-B now is that those listing space have too much, and there is no demand. Those holding Air B-n-B real estate are stuck with extra real estate they can’t rent out. So Air B-n-B (and other businesses based on the same business model) are failing.
I’m sure you can already see how this might relate to AI careers! You don’t want to be like an Air B-n-B real estate investor, and spend years investing in a failed business model, right? The good news for you is there is a way for you to avoid this if you proceed wisely. Read on!
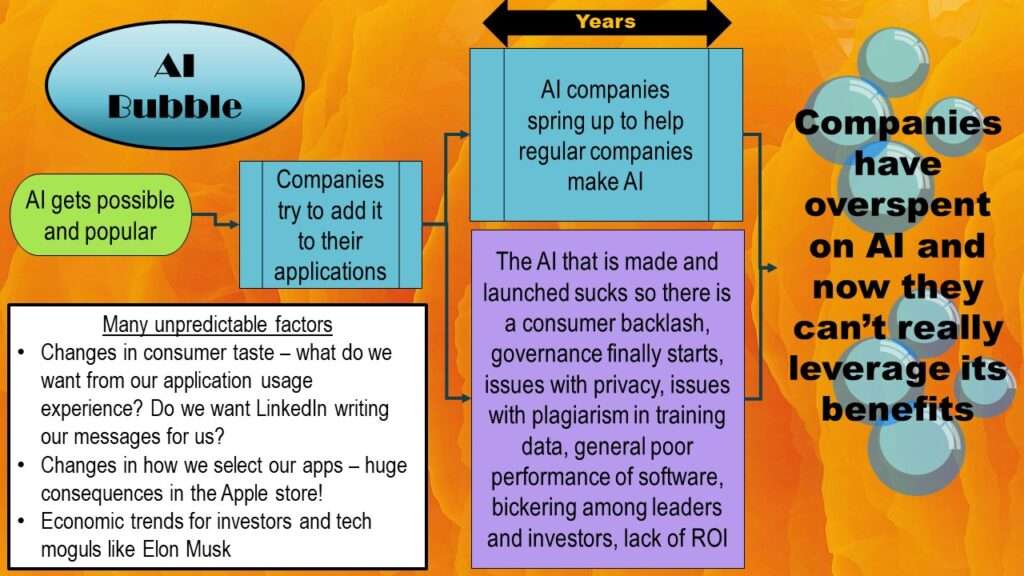
Okay, here is the AI bubble. It has mainly the same boxes, but it’s filled in differently so it reflects our use-case.
Starting on the left, we see AI getting possible and popular, so companies try to add it to their applications. Remember the “years” arrow? We are in it now.
Let’s look at the blue box – how the market is adjusting. We see that AI companies are springing up to help regular companies make AI. Examples are DataRobot, OpenAI, and Stability AI, to name a few.
Now let’s look at the purple box – the changes happening simultaneously in the environment around the evolution of these AI companies. It’s instructive to think about the most recent release from OpenAI, which is voice chatbot called HER.
The HER launch has been a monumental failure. First, it uses a voice of an actress who specifically did not give her permission. Technically, they simply recreated her voice using a different person who sounds like the actress – but she’s suing them anyway.
Secondly, the voice they generated is not based actress’s normal voice. Rather, it is based on a voice she used in a specific movie when she was playing an operating system programmed with a sexualized woman trying to persuade a man cloyingly. Yes, that’s right. In the original movie on which this fiasco is based, the computer has an operating system that was programmed uses this sexualized voice.
I tried to figure out who would see this movie, which is inaptly called a “science fiction” movie in some circles. It apparently is a romantic comedy released in 2013, where the protagonist (obviously, a man) falls in love with this sexualized operating system. Though it is not a movie designed for serious technologists or science fiction fans, apparently it was rated highly. Nevertheless, I will quote from a review in the Rolling Stone to summarize what I was thinking about the voice used by the actress in this movie: “…[she speaks] in tones sweet, sexy, caring, manipulative and scary”.
This is the same sexualized voice that makes you titillated when you hear it from your girlfriend, but creeped out if you hear it out in public. Even a male sexualized voice would be creepy. This doesn’t even take market research to deduce.
Additionally, ChatGPT, HER, and other products by OpenAI have been questionable in their use of training data. Training data are datasets used to train models. So, if they are training a chat model, they are using original phrases from the training data. This makes you wonder – is it fair to use copyrighted materials in doing this? Probably not, right?
But forgetting about fairness, there is a bigger logistical problem from a scientific view. If you are using copyrighted material to make a chatbot to work on open source problems, are you even using the most appropriate training data? The training data should match the real-world data as much as possible – so if you are developing a chatbot for a call center that handles inquiries about an electronic medical records software, you can’t use the same training data for a call center that handles inquiries about customer relationship management software. Duh!
In the end, it just comes down to poor performance. Air B-n-B caused their customers to have negative experiences because their service performed poorly, and now we have poorly performing AI tools that are giving data scientists negative experiences. Like with Air B-n-B, this is impacting the business of AI. Investors and leaders are bickering (as you may have heard specifically at OpenAI and Stability AI), and the more they mess around, the less likely they are to get a return-on-investment (ROI).
In the end, on the right side of the graphic, we will eventually get to the point where companies have overspent on AI, and can’t really take advantage of the benefits. Imagine that a rideshare company builds a big AI platform to enhance their profits by doing a better job of choosing the right customers, choosing the right drivers, choosing the right prices, and choosing the right routes.
How can they sustain such an AI enterprise? They will have to monitor it, updated it as consumer preferences change, improve it as regulatory changes happen, and so on. They will need to keep paying big bucks to AI professionals, and paying big bucks for big data storage. They better save a boatload of cash through this AI enterprise in order to be able to keep paying for it. Will it get them an ROI in the end? I doubt it.
Career Advice for Riding the AI Bubble
If you’ve read everything I’ve said up to this point, you might be thinking, “I would be a fool to plan for an AI career!” But don’t you want to cash in on the short-term salary advantage you can get by fashioning yourself as an AI data scientist? Here’s my foolproof advice for those who want AI careers:
- Practice with commercial AI tools like DataRobot and Amazon Web Services (AWS) if you have free access to them. Free access for you could be through a college program, or through an employer. Because you have free access, you should take an opportunity to learn the tools available until you do not have free access. Still, you should choose wisely how you devote your time – choose more popular tools, or tools you like that you want to work with at your job in the future.
- If you do not have free access to commercial AI tools, practice with open source AI tools (like those that work with R and Python). Not having access to commercial tools is not really a disadvantage, because there are many job positions where use of open source AI tools is requested. Also, you can learn the same principles and processes regardless of the AI tool you are using, so open source is a good way to practice.
- For practice: Design, execute, and publish a complete and independent AI portfolio project online. This is admittedly the hardest part of the advice to execute. Projects done to help students learn AI in college programs or as part of coursework don’t really represent real world projects, while your independent AI portfolio project should. Kaggle competitions also use sanitized and constructed datasets, and in real AI jobs, you have to assemble and specify your own dataset and model from scratch.
The third piece of advice is really the most important part of this advice. If you do not do an actual project based on a real world scenario, you won’t be able to learn how to use the tools properly. And if you don’t do a good job creating a research question, executing your methods, and getting interpretable results so you can give an evidence-based answer and clearly communicate it (to potentially untechnical and low-intelligence managers), you don’t really have a project worth showcasing. That’s what makes this method foolproof – even after all of us have moved on from AI, you will still have answered a research question with actionable results in the form of a published report online. That’s what makes your project valuable in any era.
Finding a mentor or a mentoring program for those developing AI careers that is worth the time, money, and effort they will devote to it is actually not easy. I realized that when I was trying to help the customers of my career coaching program. To solve that pain point, I developed an online self-paced data science group mentoring program for making portfolio projects. I encourage you to check it out and connect with me if you think it is something you would like to do!
Read all of our data science blog posts!
AI careers are not easy to navigate. Read my blog post for foolproof advice for those interested in building a career in AI.


