Tag Archives: software

Sort Order, Formats, and Operators: A Tour of The SAS Documentation Page

SAS software sorting a to z or using arithmetic operators

Get to know three of my favorite SAS documentation pages: the one with sort order, the one that lists all the SAS formats, and the one that explains all the SAS operators and expressions!

Data Scientists Interested in Encryption Should Take this Online Cryptography Course

Cartoon of person programming with code in the background

Even if you do not deal directly with cryptography, the need to maintain data privacy often leads data scientists to need to study cryptography. This basic online course is part of an ethical hacking certification and gives a basic overview of issues with data transfer and cryptography.

Understand US Payroll Data from this Online Course about Payroll

Check with payroll royalty data processing

If you receive payroll in the US, you can see that the data on the payroll stub is pretty complicated. This course in payroll is helpful for data scientists who find themselves analyzing US payroll data, because it explains the business rules and regulations behind the data.

Announcing the Publication of my New SAS Book on Data Warehousing

Learn how to do data warehousing in SAS. You can purchase this book and use the code in it to help you.

SAS is known for big data and data warehousing, but how do you actually design and build a SAS data warehouse or data lake? What datasets do you include? How do you transform them? How do you serve warehouse users? How do you manage your developers? This book has your answers!

Data Curation Course: Learn Data Curation Online from LinkedIn Learning!

Learn how to do data curation on LinkedIn Learning!

Curation files are especially helpful for communicating about data on teams. Learn more about what you’ll learn when you take my online LinkedIn Learning data curation course!

Doing Surveys? Try my R Likert Plot Data Hack!

The Likert package in R can visualize categorical data.

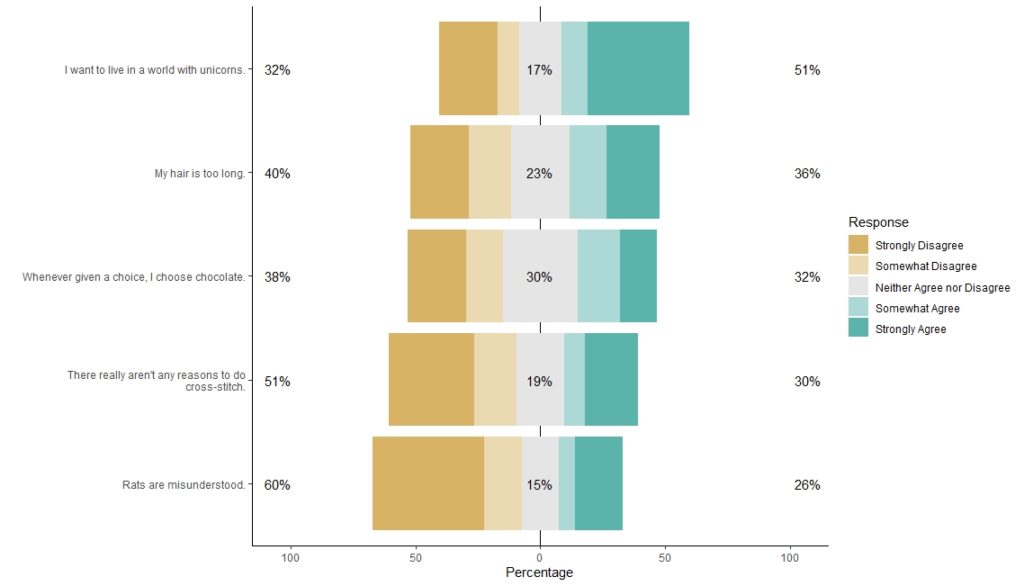
I love the Likert package in R, and use it often to visualize data. The problem is that sometimes, I have sparse data, and this can cause problems with the package. This blog post shows you a workaround, and also, a way to format the final plot that I think looks really great!

Fall 2020 Update: Education Mission in the End of Days!

Images of fall leaves on trees on a road in New England

After being hit with the pandemic, I’m racing to catch up with my blog! Here are a few announcements of new courses, new scientific papers, and new ideas on data science!

Review of Snowflake “Data for Breakfast” – Boston, March 4, 2020

Snowflake is a cloud data platform for big data analytics

Snowflake is a new big data cloud back-end solution, and the company has been holding “Data for Breakfast” meetings in many different cities to introduce data scientists to their product. I went to the meeting held on March 4, 2020 at the Marriott Long Wharf in Boston, and here is my review. Not My First […]

We Analyzed Public Data on Massachusetts Casinos and Were Surprised by What We Found

Cards and Poker Chips on Green Felt at a Casino

Want an example of a portfolio project in data science? We analyzed data on Massachusetts casinos that was in the public domain as an example. Read this blog post for the results!

I Installed the Free “SAS University Edition” and Here’s What I Recommend: Part 2

Install Free SAS in 4 steps Install Free SAS University Edition

SAS University Edition is free to use and helpful for the learner, but it is honestly very hard to download and set up, because there are many complex steps. SAS provides guidance, but there are a lot of confusing parts to the process. This post is the second in a four-part series that helps walk […]

Verified by MonsterInsights