As you can imagine, my goal was to keep up my blog all year. I’ve been busy on an education mission. But then, God started a global pandemic, and I’m an epidemiologist, so you can just guess what happened to my schedule.
God willing, I have been extremely productive during the end of days. I really shine during apocalypses – you should have seen me during the tech bust back in 2000! But the sad truth is that I didn’t write anything about it on my blog, so now I have to catch up. I’ll start by making this blog post to sum up what I’ve been up to, in case you all have been wondering.
Mission #1: Prevention of COVID-19 Transmission Through Education
I started the end of days trying to spread some good information about how to protect yourself from COVID-19. But on March 28, 2020, we didn’t have that much information on how to protect yourself from COVID-19.
Almost immediately, my wonderful colleague Dr. Catherine Seo at Lipedema Simplified contacted me and asked if I’d do a Zoom presentation for her online community.
The important thing about lipedema in terms of COVID-19 is that it is one of those “underlying co-morbidities” that can make you at high risk for getting very sick and dying from COVID-19. Therefore, even back in March before everyone was touting masks, I got on the Zoom call, told them I’d send them a link to a YouTube video from Hong Kong on how to make a homemade mask, and then I expected them to do it and wear it.
Other amazing presenters:
Dr. Seo herself: She did the keynote of the webinar, providing information and inspiration for those navigating the pandemic with lipedema or related disorders
Leslyn Keith: Leslyn is a close colleague and an adept lipedema clinician and researcher who presented on health maintenance during isolation.
Raeann Sparks: Although all of us were pretty good, Raeann was the star! Raeann described surviving COVID-19 with lipedema. She gave us all inspiration!
Mission #2: Update Efforts Toward Anti-racism Education
I could not have predicted what happened to George Floyd this year in June, but I could have predicted that the Minneapolis Police would kill a Black man with their hands in broad daylight. That is because I grew up in Minneapolis and started fighting this problem long ago, in the 1990s. I began to educate myself back then in anti-fascist, anti-violent, anti-sexist, and anti-racist philosophy. I finally decided that I needed to really focus my efforts in life on smashing the patriarchy.
As a result, I usually try to weasel my way onto the author line of scientific publications about anti-racism. My kind friend Dr. Kechi Iheduru-Anderson indulged me, and we were able to co-author the following items that were published recently:
- United States Health Care Settings: Kechi designed and executed this study, and I helped with the write-up. Some of the quotes in it really pain a dark picture of this experience, which makes me sad, since I want to be proud of how the US treats its immigrants.
- Proposal for a Global Agenda to Eliminate Racism in Nursing and Nursing Education: This is actually a book chapter in a book called, “Civil Society and Social Responsibility in Higher Education”. I really feel strongly about what we say in here. Check it out!
As an aside, Kechi recently had a boomlet of attention with the publication of her solo-authored work, “The White/Black hierarchy institutionalizes White supremacy in nursing and nursing leadership in the United States”. If you are in the mood to get enraged, just read some of the quotes in this article.
Read it here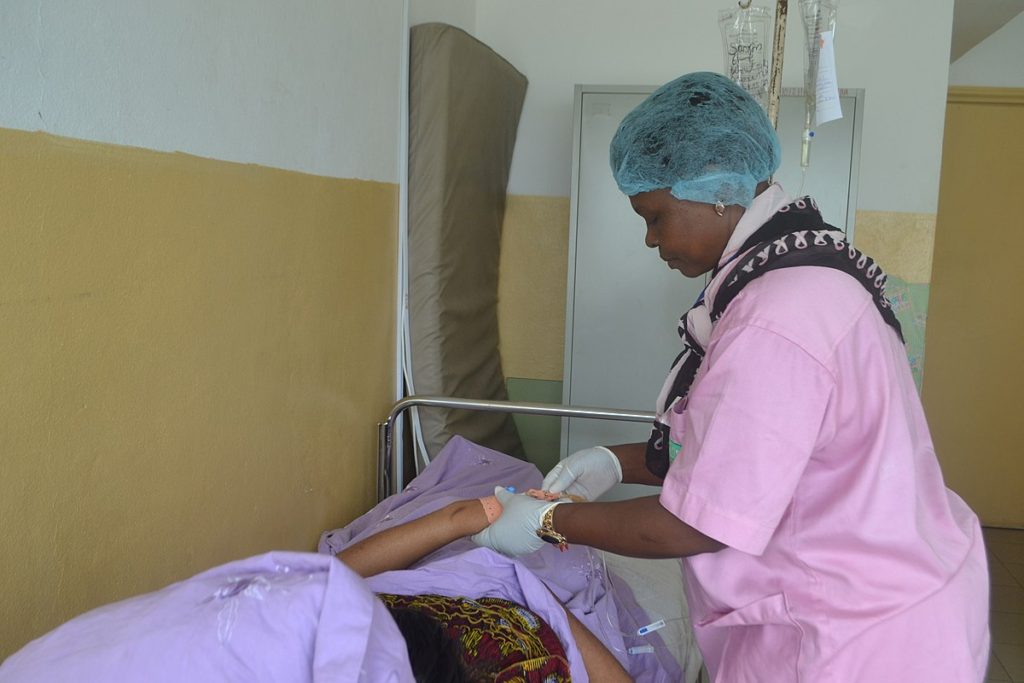
Mission #3: Update on New Research
In my education mission as I keep helping clients with different projects, I thought I’d put together a short, curated reading list of some articles that I found particularly good:
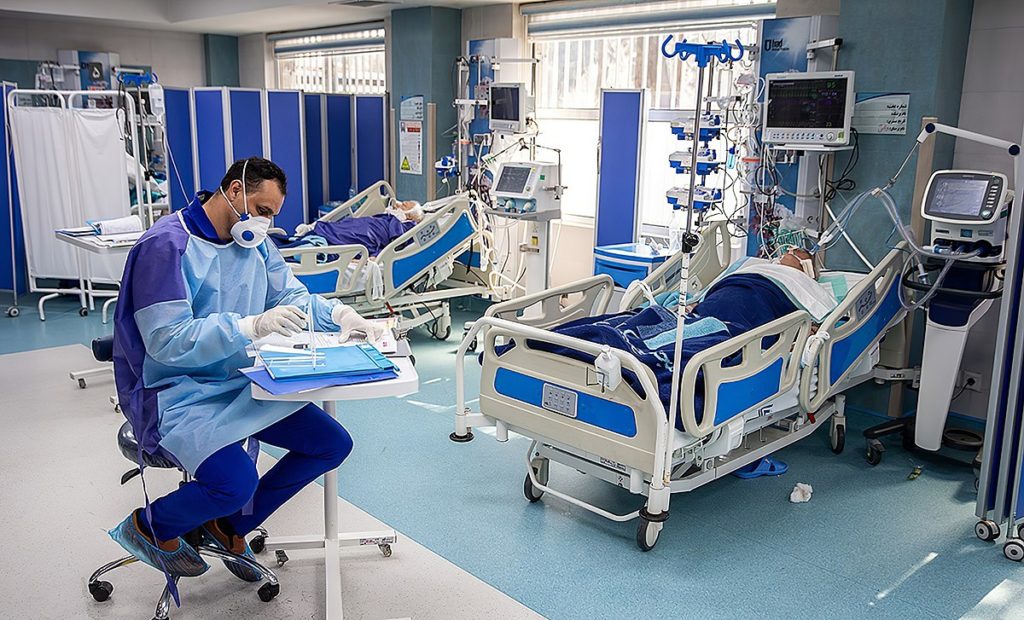
Burnout in the ICU
Citation: Chuang, C. H., Tseng, P. C., Lin, C. Y., Lin, K. H., & Chen, Y. Y. (2016). Burnout in the intensive care unit professionals: A systematic review. Medicine, 95(50).
Why it’s so good: It really sums up the risk factors for burnout, which are pretty important now that we have this COVID-19 pandemic and people are working too much.
Read Article
COVID-19 Causing Psychological Distress in China
Citation: Qiu, J., Shen, B., Zhao, M., Wang, Z., Xie, B., & Xu, Y. (2020). A nationwide survey of psychological distress among Chinese people in the COVID-19 epidemic: implications and policy recommendations. General Psychiatry, 33(2).
Why it’s so good: The authors are Chinese, and developed a survey instrument in Chinese and administered it. It looks pretty good for use in the general public, and they sent me a copy of the translated version, so it can be used in other populations.
Read ArticleSaudi Arabia’s Response to COVID-19
Citation: Alshammari, T. M., Altebainawi, A. F., & Alenzi, K. A. (2020). Importance of early precautionary actions in avoiding the spread of COVID-19: Saudi Arabia as an Example. Saudi Pharmaceutical Journal.
Why it’s so good: It goes over dates and times of happenings as the COVID-19 outbreak hit Saudi Arabia, and explains very clearly the different containment and mitigation policies put in place. Also has a very useful graphic.
Read Article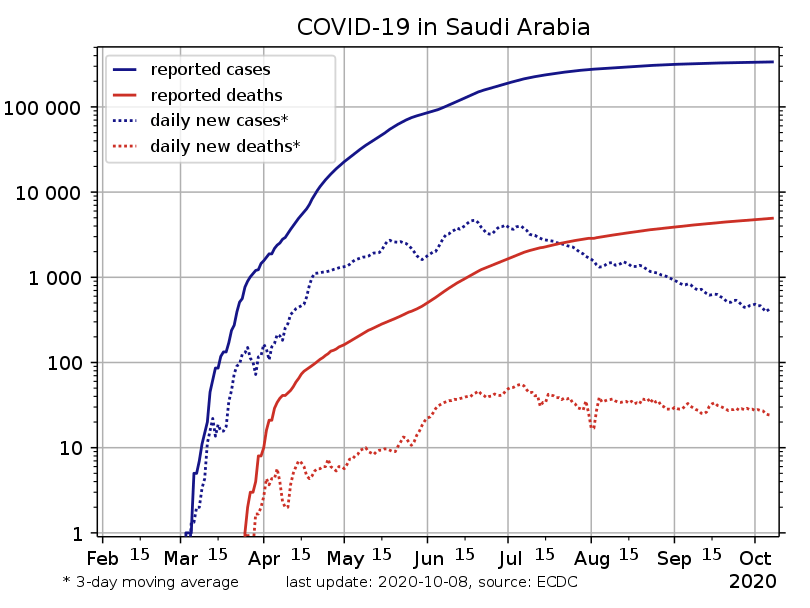
Mission #4: Deliver Education: Courses and Content
Over the last year, I have two new courses on LinkedIn Learning:
The Data Science of Experimental Design
If you’ve ever wanted to do A/B testing, setting up the software isn’t the only thing you need to do. You need to actually design the study, and plan what you will do depending on the results, which is what you’ll learn in this course.
Take the course
Data Curation Foundations
This course doesn’t use statistical software! Instead, you use Microsoft Word, Excel, and PowerPoint (as well as whatever graphic and text software you like) to make tables and images to document and communicate about data.
Take the course
I’ve also published some more papers and book chapters, and am getting ready to come out with a book on SAS data warehousing.
Stay tuned!
Want to find out when my SAS book comes out? Enter your e-mail address into the box in the right margin to join my blog and get an e-mail whenever I publish.
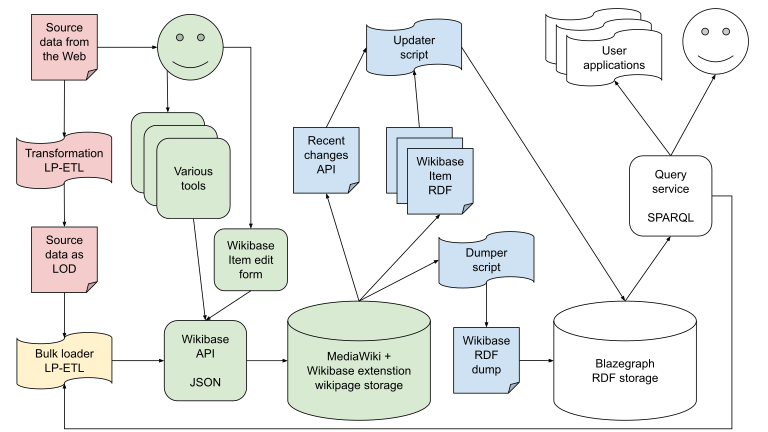
Updated October 8, 2020. Added FTC disclaimer on December 5, 2020. Pictures of fall leaves by Sheba_Also 43,000 photos, available here. Picture of nurse by Minette Lontsie available here. Picture of intensive care unit by Mohsen Atayi available here. Picture of Chinese children playing by Fernando Mafra from São Paulo, Brasil available here. Graph of Saudi Arabia response to COVID-19 by Hbf878, available here. Data flow diagram by Jakub Klimek, available here.
.jpg)
.jpg)
After being hit with the pandemic, I’m racing to catch up with my blog! Here are a few announcements of new courses, new scientific papers, and new ideas on data science!