Counting rows in SAS and R is approached differently, because the two programs process data in different ways. Read my blog post where I describe both ways.
Tag Archives: business data
07
Jan
Jan
Native formats in SAS and R of data objects have different qualities – and there are reasons behind these differences. Learn about them in this blog post!

06
Jan
Jan
Paid mentoring for data science can be worth the cost in certain circumstances – but not others. My blog post provides guidance on hiring a paid mentor.
26
Dec
Dec
Looking for a SAS-R integration example that uses the best of both worlds? I show you a use-case where I was in a hurry, and did transformation in R with the analysis in SAS!
29
Nov
Nov
Want to get started learning about SAS macros? This blog post provides SAS macros for beginners with video tutorials to walk beginners and code newbies through the basic steps!
Data Science
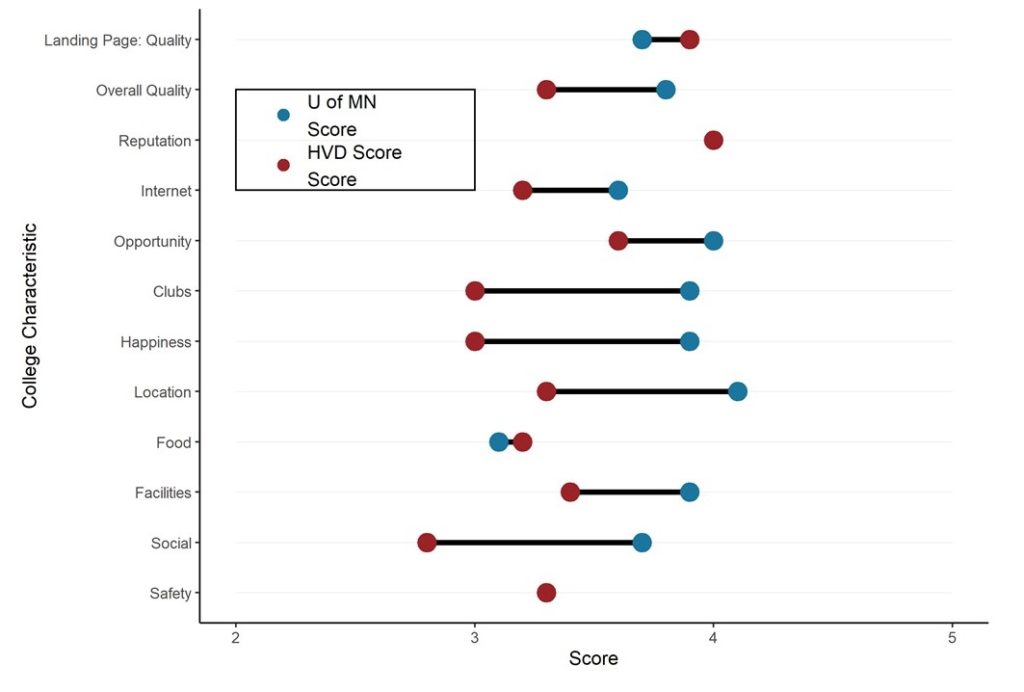
Dumbbell Plot for Comparison of Rated Items: Which is Rated More Highly – Harvard or the U of MN?
20
Sep
Sep
Want to compare multiple rankings on two competing items – like hotels, restaurants, or colleges? I show you an example of using a dumbbell plot for comparison in R with the ggalt package for this exact use-case!
Quality Assurance/Quality Improvement (QA/QI)
“Bad Blood” is a Lesson in How Bad Leadership Leads to Bad Data: Part 4 of 5
05
Jul
Jul
As a data science leader, what should you put in place so your organization doesn’t end up a data mess like startup Theranos? This blog posts provides guidance.
21
Jun
Jun
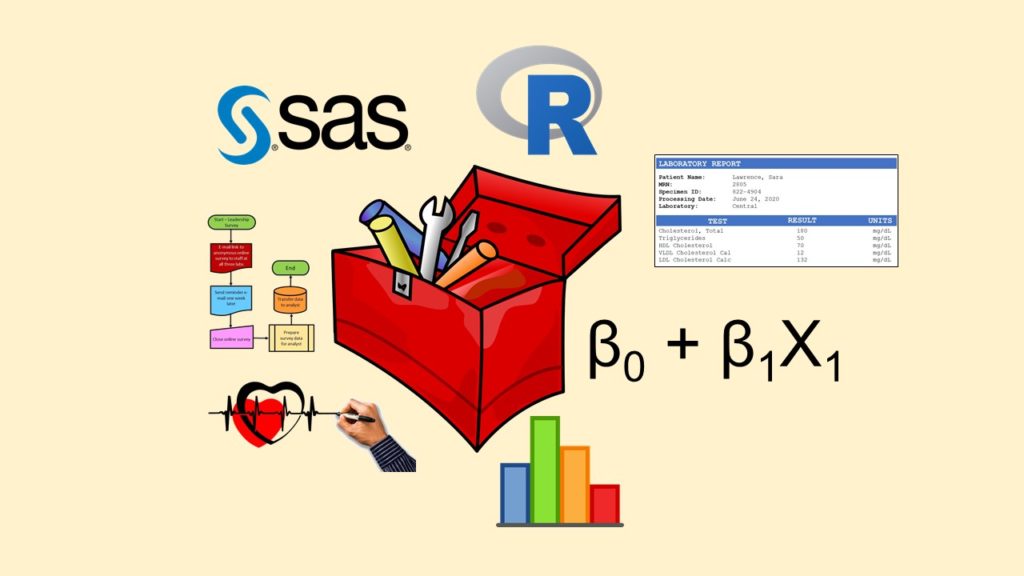
Monika posts her “data science newbie do-it-yourself starter kit”, with links to cheap or free learning resources for the data science newbie who wants to get started in healthcare analytics.
- 1
- 2