SAS is known for big data and data warehousing, but how do you actually design and build a SAS data warehouse or data lake? What datasets do you include? How do you transform them? How do you serve warehouse users? How do you manage your developers? This book has your answers!
Tag Archives: data analytics
19
Oct
Oct
Curation files are especially helpful for communicating about data on teams. Learn more about what you’ll learn when you take my online LinkedIn Learning data curation course!
14
Oct
Oct
I use the datasets from the Behavioral Risk Factor Surveillance Survey (BRFSS) to demonstrate in a lot of my data science tutorials. The BRFSS are free and available to the public – but they are kind of buried on the web site. This blog post serves as a “map” to help you find them!
11
Oct
Oct
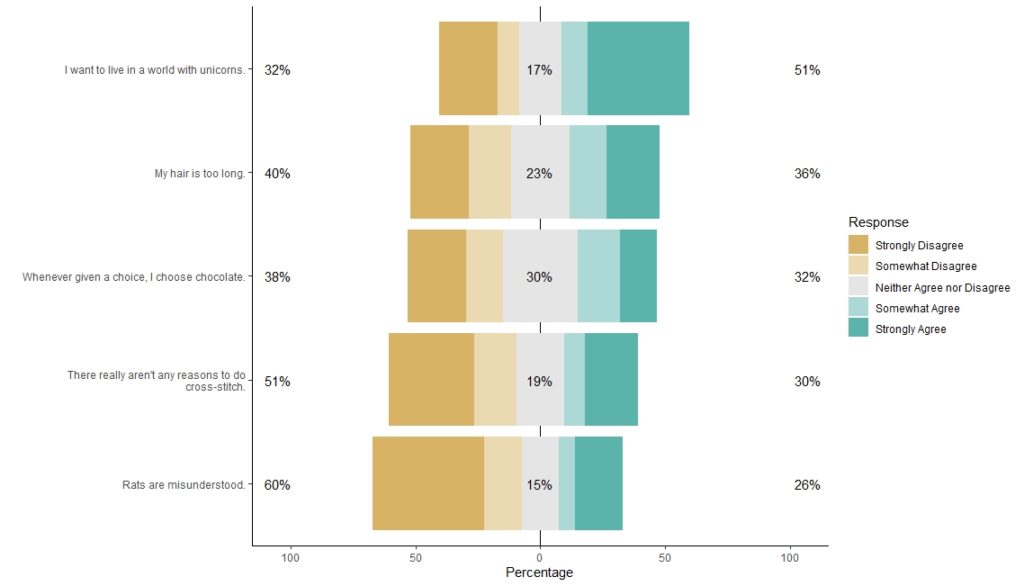
I love the Likert package in R, and use it often to visualize data. The problem is that sometimes, I have sparse data, and this can cause problems with the package. This blog post shows you a workaround, and also, a way to format the final plot that I think looks really great!
14
Mar
Mar
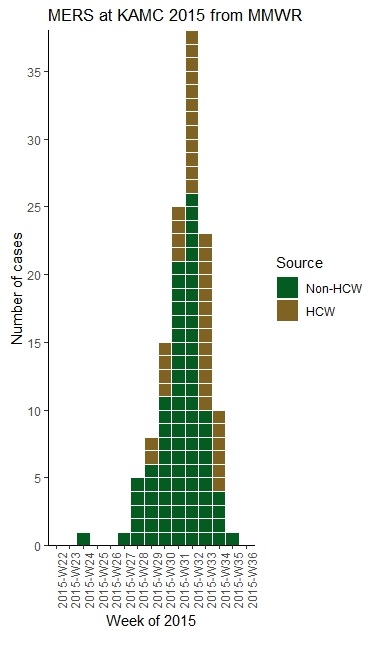
With all this talk about “flattening the curve” of the coronavirus, I thought I would get into the weeds about what curve we are talking about when we say that. We are talking about what’s called an epidemiologic curve, or epicurve for short. And to demonstrate what an epicurve is and what it means, I […]
04
Mar
Mar
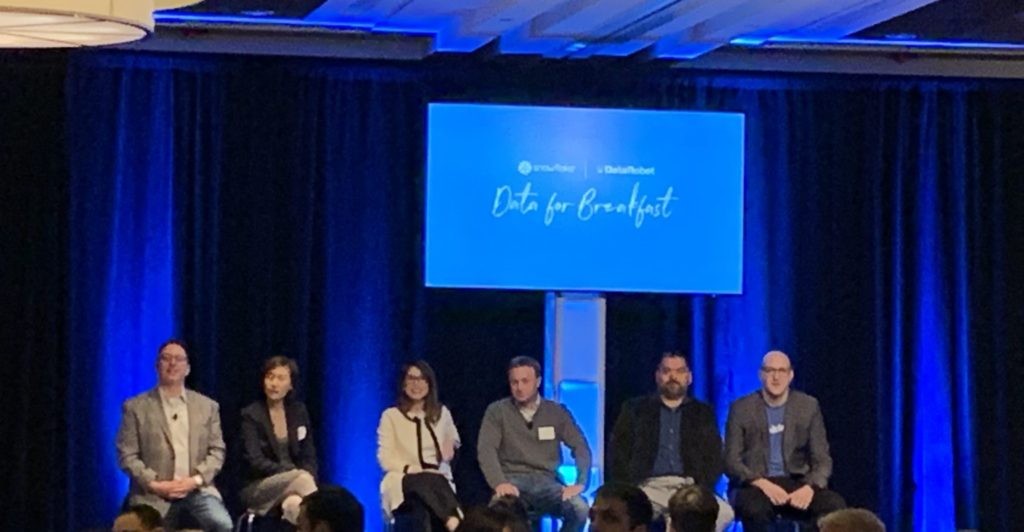
Snowflake is a new big data cloud back-end solution, and the company has been holding “Data for Breakfast” meetings in many different cities to introduce data scientists to their product. I went to the meeting held on March 4, 2020 at the Marriott Long Wharf in Boston, and here is my review. Not My First […]
02
Mar
Mar
I encourage those of you into data science and AI to sign up to receive digests from Data Science Central. I happened upon this web site when looking for some references for a book I am writing, and found some amazing articles. Since I’m into data science in and AI in healthcare, I was intrigued […]
Career Development
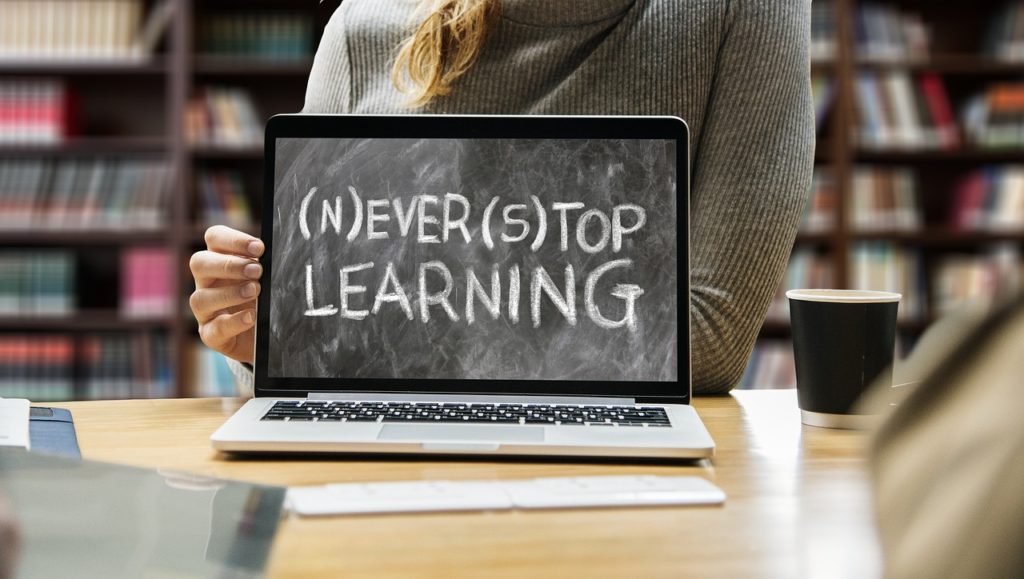
Physical College Classrooms are so Yesterday. Why Are We Still Studying Deeper Learning in Face-to-Face Settings?
17
Feb
Feb
My colleague who is a professor at Fitchburg State University studies deeper learning in face-to-face and online approaches in higher education. The idea is that if educators use deeper learning approaches, the students will learn more efficiently. Others have talked to me about deeper learning, and when I looked into it, I found that the […]

02
Sep
Sep
I’m one of those people in the “over age 45” demographic who is not against Instagram, but never really picked it up. Therefore, it’s probably amazing that I’m doing an Instagram campaign. As a user, I’m bad at taking pictures. My arms are too short for selfies. As a consumer, I’m bad at looking at […]