Descriptive analysis of Black Friday Death Count Database provides an example of how creative classification can make a quick and easy data science portfolio project!
Tag Archives: causal inference
Classification crosswalks are easy to make, and can help you reduce cardinality in categorical variables, making for insightful data science portfolio projects with only descriptive statistics. Read my blog post for guidance!
R for logistic regression in health data analytics is a reasonable choice, if you know what packages to use. You don’t have to use SAS! My blog post provides you example R code and a tutorial!
Curated datasets are useful to know about if you want to do a data science portfolio project on your own. I made this blog post for our group mentoring program. Check out the ones I am promoting on my blog!
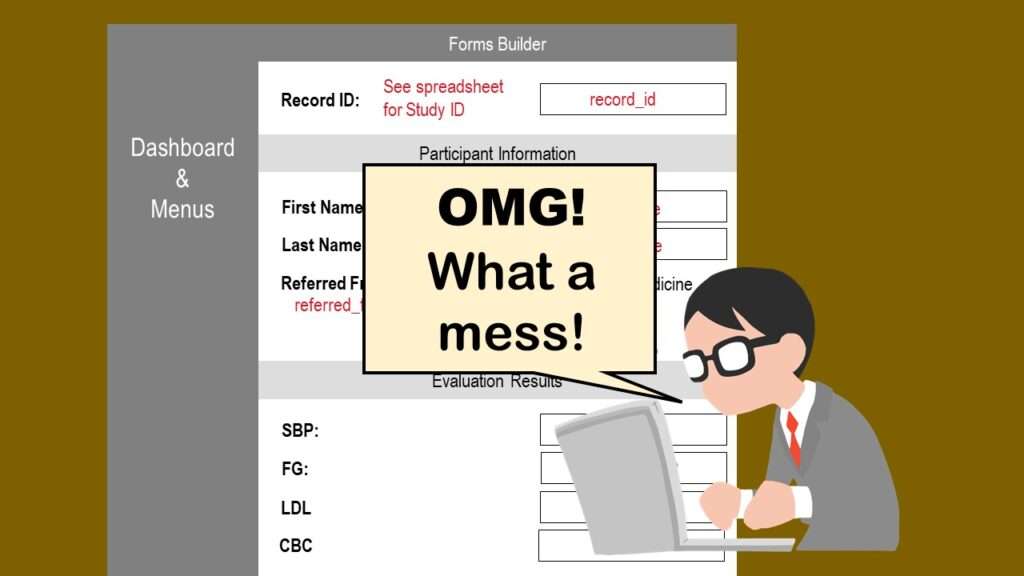
REDCap mess happens often in research shops, and it’s an analysis showstopper! Read my blog post to learn my secret tricks for breaking through the barriers and getting on with data analytics!


