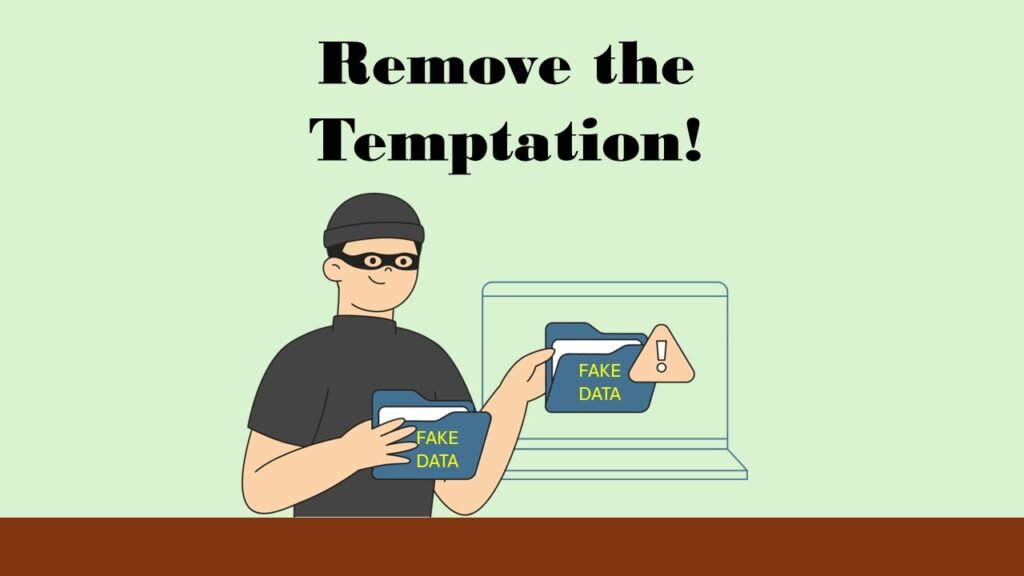
Prevent research misconduct instead of waiting for it to happen – what a concept! But it’s actually not that hard. It’s similar to other types of crime prevention – don’t make the crime tempting and easy to execute.
One of the best ways to prevent crime in the workplace is not hiring criminals. This is also a good way to prevent research misconduct among academics working at institutions of higher education – don’t hire people who are guilty of it! This blog post will focus on describing a simple screening process that can be done on job applicants in academia to help you avoid hiring scientists who don’t follow the rules. This blog post will end with a few other tips – for both colleagues and leaders in academia – about how to prevent research misconduct in the workplace.
Why it is Important to Prevent Research Misconduct – the Arday Affair
Before I continue too far, I want to take the opportunity to elevate YouTube creator (and Substack author) Chris Brunet, who produces content focusing on research misconduct, mostly in the field of economics which is his field of expertise. Please follow his content if you are interested in research misconduct and investigative journalism.
A lot has been written on the Arday affair, but I especially want to point you to a video Chris Brunet published on his YouTube channel.
The video gives a lot of background about Jason Arday, a professor at the University of Cambridge (in the United Kingdom), who took his own life after being investigated and fired under allegations of research misconduct. While I encourage you to watch the whole video – which traces Arday’s life from youth to the current time – I want to focus on the part where he was hired as a professor at the University of Cambridge in 2023. If in 2023, Arday had been screened for plagiarism prior to his hiring, it would have been found that he had committed rampant plagiarism in his PhD thesis, as well as several academic papers. Presumably, if Cambridge had realized this when he was being considered as a job candidate, he would not have been hired. Yet, he was not screened, and was hired anyway.
Unfortunately, his hiring led to accusations of his research misconduct eventually being identified and magnified, and him getting on the radar of many different people who wanted him investigated, as Chris covers in his video. This ultimately led to Arday taking his own life. My argument is that had the University of Cambridge acted more responsibly, this whole affair could have been avoided, and Arday might still be alive today.

Checking for Plagiarism
As many people know, there are simple ways to check for plagiarism. There is a lot of available plagiarism-checking software. Many institutions use TurnItIn. I am not a big fan of TurnItIn because it tries to oversimplify the investigation of plagiarism – but I still think it can be useful if deployed properly by a human (and not some sort of automated, artificial-intelligence-enabled process).
I looked up an example of a TurnItIn report – you can find one here. I made a diagram so I can explain exactly what I mean.
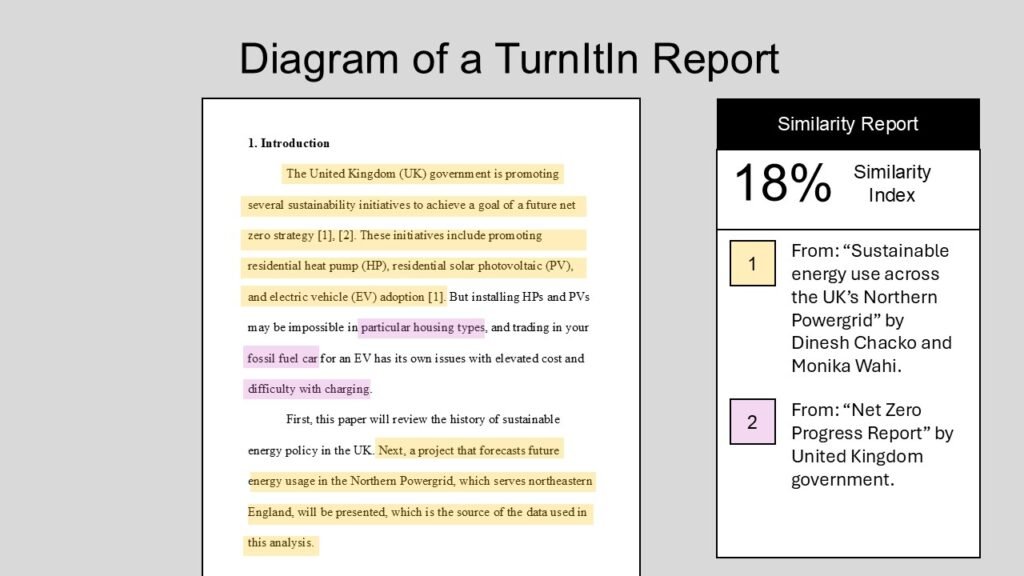
As you can see in the diagram, there are two kinds of plagiarism highlighted – entire passages that are highlighted in yellow, and some phrases that are highlighted in purple. Then there is a “similarity index” of 18%. The similarity index is literally meaningless, because the phrases highlighted in purple are obviously not plagiarism. But the entire sentences that are highlighted in yellow – those are plagiarism, and because the report lists the original document that was plagiarized, these can be verified.
TurnItIn generates a lot of false positives, which is why TurnItIn software is not ideal and has many complaints. However, if you use it right, and use your own judgment with respect to what it highlights, you can get a very good read on whether someone is actually plagiarizing or not. Further, you can use other software to validate what you find, as well as dig into the original documents highlighted by the software to ensure the accusation of plagiarism is actually correct.
But Arday Didn’t Just Do Plagiarism
As Chris pointed out in his video, Arday apparently also committed research misconduct by way of data falsification. It is much harder to investigate this type of research misconduct. But my point is he apparently engaged in plagiarism first, before the data falsification.
When I used to work in the juvenile justice system, it was understood that truancy – meaning kids not going to school – was a huge risk factor for criminality. Not all kids who got in trouble with the law started out as truant, but being truant led to a lot of illegal behavior.
A parallel can be seen with academics and plagiarism. Plagiarism is often one of the first types of research misconduct done by academics who go on to do other kinds of research misconduct. And like truancy, it is relatively easy to catch with software like TurnItIn if it is used right. Therefore, I strongly advocate that every institution hiring academics should check their existing published works – including their doctoral dissertations – for plagiarism before they are hired.

Whose Fault was the Arday Affair?
Chris Brunet says in his video,
A lot of people are blaming white supremacy or the media. There are literally hundreds of articles with the exact same title, which is “The Media Lynched Jason Arday”. I think this is lazy, and missed the mark, because if you commit rampant fraud, and you are called out for it, it’s not really the person’s fault for calling you out for it, it’s your own fault.
Up to here, I agree with Chris Brunet. It’s this next part I don’t agree with:
And so, ultimately, I think what happened here is that the liberal establishment promoted Jason Arday beyond his capabilities, and held him to a lower standard, and did not give him any scrutiny, and just clapped along, because they wanted this DEI mascot to hold up to the world, to prove how enlightened they are.
The reason I don’t agree with this is that although Jason Arday happened to be Black, most of the people caught after years of research misconduct are actually white. This is because academia is literally filled with white people, and if you look at the leadership in most colleges in the United States, the UK, Canada, and other countries that are majority white, you’ll find that most of the academics working there are white people.
That’s not saying that white people are more likely to engage in research misconduct – it’s just saying that it’s proportional to the background population. It’s just numbers. So how did all those white people who committed serial research misconduct get hired into higher levels of academia? Was the so-called liberal establishment clapping along with them because they were DEI mascots? Obviously not.
So while Chris Brunet blames the so-called “liberal establishment”, I actually blame the academic institutions. The reason that Arday and other academicians of all races who engage in serial research misconduct are able to do so is that these institutions literally do not do anything to prevent it. It’s like they are leaving a $20 bill out and expecting people not to steal it.
So what should the University of Cambridge have done to prevent the Arday affair? They should have checked his doctoral dissertation and existing published works for plagiarism as part of his hiring process. They should check everyone’s published works for plagiarism routinely before they hire anyone. It’s that simple. If that had done that, they would have found Arday’s plagiarism before he was hired, and not hired him, and he might be alive today.

But What About Preventing Other Research Misconduct?
Plagiarism is kind of a “sentinel event” for research misconduct. Francesca Gino, a Harvard researcher currently accused of serious research misconduct (including data falsification) was found to have plagiarized from blogs and news reports in the books she wrote. Had Harvard (or even the publisher of her books) routinely checked her work for plagiarism, they might have found it and prevented her from engaging in further research misconduct.
There are many other cases of academics who plagiarize a lot before they are caught, and when they are caught, they are found to be doing other types of research misconduct as well. If you want more examples, just read RetractionWatch. Researchers like Arday who are shown to have engaged in serial research misconduct get bolder and bolder until there are eventually some bright red flags and someone notices, as what happened with Arday. Then, there is some huge investigation, a lot of accusations flying around, and lots of damage that needs to be cleaned up – including article retraction and people getting fired. All of this could be prevented if faculty who publish (and especially those who publish a lot) are routinely screened by their academic institution for plagiarism.

Three Tips to Prevent Embarrassing Research Misconduct
As promised, I will now provide three tips on how to prevent research misconduct other than plagiarism. These are not foolproof, but they will reduce the likelihood such academics will engage in research misconduct once they are hired.
1. Make sure scientific papers reporting original research actually are associated with a real dataset
When you work as a faculty at a college and go to publish a peer-reviewed paper, you usually have to report it somewhere. Otherwise, you won’t get support for the publication fee, and also, you won’t get credit for it that you need for your tenure packet or promotion. It is at that point that some routine investigation should be done.
If you collected your own human research data, you would have needed some sort of ethical board approval (or exemption). Can you demonstrate that you got this? Also, where are these data you collected? Does more than one person on your team have access to them? Can anyone verify that you didn’t make up the data yourself?
As I was writing this, I came across the case of Sarah Baldeo, who is the founder and CEO of ID Quotient Advisory Group, a business in Canada that has been around for at least two years. According to RetractionWatch, after Baldeo published a single-authored paper about generative artificial intelligence reliance and executive function attenuation, some researchers read the paper and identified issues:
Their concerns included inconsistencies in graphs and results, study design, “erroneous” references and a lack of ethics approval.
The paper claims to have data from 1,923 individuals who participated in a behavioral study. The journal requested the data from her, which she never supplied, so a lot of people out there believe she probably just fabricated the dataset – and the journal ended up retracting the paper.
I had never heard of ID Quotient Advisory Group before this, and now I am sure I will never hire them. According to LinkedIn, ID Quotient Advisory Group has 11-50 employees. So Baldeo, as the CEO, could have set up internal policies that enforce research teams to cross-check their data, and to ensure all studies are approved by an independent ethical body. Maybe she didn’t fabricate the dataset – who knows? But if she had set up these internal checks, it would have prevented this embarrassing highly-public retraction that now has severely tarnished the reputation of a business she founded.

In the past, I have been approached by academics who are asking me to analyze their data. Yet, they can’t provide me with any evidence that they got ethical approval to collect the data. They can’t show me an approval letter, any data collection forms, or any research protocols. I literally have no evidence that they didn’t just make up the data. In those cases, I say, “See ya!”
Maybe instead of collecting your own data, you downloaded it from some web site. Can this be verified? Can someone else go download the same data and verify that the variables in it match the variables you are writing about?
This is not a very heavy investigation to do. Data falsification is still possible – but if scientific writers know that these verification steps are going to happen, they will be less likely to just make up data out of thin air.
2. Make research teams write extensive research protocols that are on file before collecting data
In the 1990s, having an extensive research protocol associated with research studies – especially human research studies – was expected. Research protocols were often over 100 pages long. However, over the years, ethics boards have become overburdened, so these days, they just ask you to submit a basic research plan for review.
While I understand this is useful to streamline the work of the ethics board, research teams should also required to have a fully-documented research protocol that exists in the background, and serves as the controlling document for the proposed study. All members of the research team should have at least read-only access to this so they can look information up and follow it.
This is a good way of preventing “hypothesis-creep”, where papers on a study conveniently reword their hypothesis after getting their data. It’s also a good way of making sure papers honestly report the methods they used to conduct their research.

3. Have policies surrounding the use of datasets in statistical analysis, as well as mandate the storage of official computer code associated for each analysis that can be reviewed
I can’t tell you how many times I have encountered research teams that are confused as to which dataset was used for which analysis, and what happened to the statistical code that was used. Many research teams literally have no data curation. This is a huge research misconduct risk.
If I come into a project and I’m trying to help a research team publish, and they can’t find or verify what dataset or code was used in analyses up to that point, I literally have to start over. I have to ensure the provenance of the original raw dataset I’m going to use, and I have to make my own code. Otherwise, I can’t be sure of what happened before I got there.
Read all of our data science blog posts!
Prevent Research Misconduct, and Avoid the Drama
Prevent research misconduct, and the consequences and drama that goes with it. Use some simple, [...]
Oct
Mixed Methods Research: The Hot New Trend in Graduate School
Mixed methods research is trending now, with doctoral students and academics being pressured to do [...]
Oct
AI or Statistics – Which Modeling Approach Should You Use?
AI or statistics – two different, interrelated approaches you can use in your scientific publication. [...]
Sep
Confidence Intervals are for Estimating a Range for the True Population-level Measure
Confidence intervals (CIs) help you get a solid estimate for the true population measure. Read [...]
1 Comment
Jun
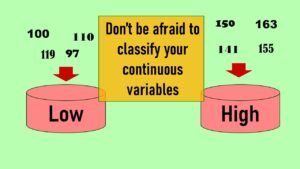
Continuous Variable? You Can Categorize it!
Continuous variable categorized can open up a world of possibilities for analysis. Read about it [...]
2 Comments
Jun
Delete if the Row Meets Criteria? Do it in SAS!
Delete if rows meet a certain criteria is a common approach to paring down a [...]
May
Chi-square Test: Insight from Using Microsoft Excel
Chi-square test is hard to grasp – but doing it in Microsoft Excel can give [...]
May
Identify Elements of Research in Scientific Literature
Identify elements in research reports, and you’ll be able to understand them much more easily. [...]
May
Design the Most Useful Time Periods for Your Conversions
Time periods are important when creating a time series visualization that actually speaks to you! [...]
Apr
Apply Weights? It’s Easy in R with the Survey Package!
Apply weights to get weighted proportions and counts! Read my blog post to learn how [...]
Nov
Make Categorical Variable Out of Continuous Variable
Make categorical variables by cutting up continuous ones. But where to put the boundaries? Get [...]
Nov
Remove Rows in R with the Subset Command
Remove rows by criteria is a common ETL operation – and my blog post shows [...]
Oct

CDC Wonder for Studying Vaccine Adverse Events: The Shameful State of US Open Government Data
CDC Wonder is an online query portal that serves as a gateway to many government [...]
Jun

AI Careers: Riding the Bubble
AI careers are not easy to navigate. Read my blog post for foolproof advice for [...]
Jun

Descriptive Analysis of Black Friday Death Count Database: Creative Classification
Descriptive analysis of Black Friday Death Count Database provides an example of how creative classification [...]
Nov
Classification Crosswalks: Strategies in Data Transformation
Classification crosswalks are easy to make, and can help you reduce cardinality in categorical variables, [...]
Nov

FAERS Data: Getting Creative with an Adverse Event Surveillance Dashboard
FAERS data are like any post-market surveillance pharmacy data – notoriously messy. But if you [...]
4 Comments
Nov
Dataset Source Documentation: Necessary for Data Science Projects with Multiple Data Sources
Dataset source documentation is good to keep when you are doing an analysis with data [...]
Nov

Joins in Base R: Alternative to SQL-like dplyr
Joins in base R must be executed properly or you will lose data. Read my [...]
Nov
NHANES Data: Pitfalls, Pranks, Possibilities, and Practical Advice
NHANES data piqued your interest? It’s not all sunshine and roses. Read my blog post [...]
Nov

Color in Visualizations: Using it to its Full Communicative Advantage
Color in visualizations of data curation and other data science documentation can be used to [...]
Oct
Defaults in PowerPoint: Setting Them Up for Data Visualizations
Defaults in PowerPoint are set up for slides – not data visualizations. Read my blog [...]
Oct
Text and Arrows in Dataviz Can Greatly Improve Understanding
Text and arrows in dataviz, if used wisely, can help your audience understand something very [...]
Oct
Shapes and Images in Dataviz: Making Choices for Optimal Communication
Shapes and images in dataviz, if chosen wisely, can greatly enhance the communicative value of [...]
Oct

Table Editing in R is Easy! Here Are a Few Tricks…
Table editing in R is easier than in SAS, because you can refer to columns, [...]
Aug
R for Logistic Regression: Example from Epidemiology and Biostatistics
R for logistic regression in health data analytics is a reasonable choice, if you know [...]
272 Comments
Aug

Connecting SAS to Other Applications: Different Strategies
Connecting SAS to other applications is often necessary, and there are many ways to do [...]
Jul

Portfolio Project Examples for Independent Data Science Projects
Portfolio project examples are sometimes needed for newbies in data science who are looking to [...]
Jul

Project Management Terminology for Public Health Data Scientists
Project management terminology is often used around epidemiologists, biostatisticians, and health data scientists, and it’s [...]
Jun
Rapid Application Development Public Health Style
“Rapid application development” (RAD) refers to an approach to designing and developing computer applications. In [...]
Jun
Understanding Legacy Data in a Relational World
Understanding legacy data is necessary if you want to analyze datasets that are extracted from [...]
Jun
Front-end Decisions Impact Back-end Data (and Your Data Science Experience!)
Front-end decisions are made when applications are designed. They are even made when you design [...]
Jun

Reducing Query Cost (and Making Better Use of Your Time)
Reducing query cost is especially important in SAS – but do you know how to [...]
Jun
Curated Datasets: Great for Data Science Portfolio Projects!
Curated datasets are useful to know about if you want to do a data science [...]
May
Statistics Trivia for Data Scientists
Statistics trivia for data scientists will refresh your memory from the courses you’ve taken – [...]
Apr
Management Tips for Data Scientists
Management tips for data scientists can be used by anyone – at work and in [...]
Mar
REDCap Mess: How it Got There, and How to Clean it Up
REDCap mess happens often in research shops, and it’s an analysis showstopper! Read my blog [...]
Mar

GitHub Beginners in Data Science: Here’s an Easy Way to Start!
GitHub beginners – even in data science – often feel intimidated when starting their GitHub [...]
Feb
ETL Pipeline Documentation: Here are my Tips and Tricks!
ETL pipeline documentation is great for team communication as well as data stewardship! Read my [...]
Feb
Benchmarking Runtime is Different in SAS Compared to Other Programs
Benchmarking runtime is different in SAS compared to other programs, where you have to request [...]
Dec

End-to-End AI Pipelines: Can Academics Be Taught How to Do Them?
End-to-end AI pipelines are being created routinely in industry, and one complaint is that academics [...]
Nov
Referring to Columns in R by Name Rather than Number has Pros and Cons
Referring to columns in R can be done using both number and field name syntax. [...]
Oct
The Paste Command in R is Great for Labels on Plots and Reports
The paste command in R is used to concatenate strings. You can leverage the paste [...]
Oct
Coloring Plots in R using Hexadecimal Codes Makes Them Fabulous!
Recoloring plots in R? Want to learn how to use an image to inspire R [...]
5 Comments
Oct
Adding Error Bars to ggplot2 Plots Can be Made Easy Through Dataframe Structure
Adding error bars to ggplot2 in R plots is easiest if you include the width [...]
Oct

AI on the Edge: What it is, and Data Storage Challenges it Poses
“AI on the edge” was a new term for me that I learned from Marc [...]
Jun

Pie Chart ggplot Style is Surprisingly Hard! Here’s How I Did it
Pie chart ggplot style is surprisingly hard to make, mainly because ggplot2 did not give [...]
5 Comments
Apr
Time Series Plots in R Using ggplot2 Are Ultimately Customizable
Time series plots in R are totally customizable using the ggplot2 package, and can come [...]
Apr

Data Curation Solution to Confusing Options in R Package UpSetR
Data curation solution that I posted recently with my blog post showing how to do [...]
Apr

Making Upset Plots with R Package UpSetR Helps Visualize Patterns of Attributes
Making upset plots with R package UpSetR is an easy way to visualize patterns of [...]
11 Comments
Apr
Making Box Plots Different Ways is Easy in R!
Making box plots in R affords you many different approaches and features. My blog post [...]
Mar
Convert CSV to RDS When Using R for Easier Data Handling
Convert CSV to RDS is what you want to do if you are working with [...]
Mar

GPower Case Example Shows How to Calculate and Document Sample Size
GPower case example shows a use-case where we needed to select an outcome measure for [...]
Feb
Querying the GHDx Database: Demonstration and Review of Application
Querying the GHDx database is challenging because of its difficult user interface, but mastering it [...]
Feb
Variable Names in SAS and R Have Different Restrictions and Rules
Variable names in SAS and R are subject to different “rules and regulations”, and these [...]
Feb
Referring to Variables in Processing Data is Different in SAS Compared to R
Referring to variables in processing is different conceptually when thinking about SAS compared to R. [...]
Jan
Counting Rows in SAS and R Use Totally Different Strategies
Counting rows in SAS and R is approached differently, because the two programs process data [...]
Jan
Native Formats in SAS and R for Data Are Different: Here’s How!
Native formats in SAS and R of data objects have different qualities – and there [...]
Jan

SAS-R Integration Example: Transform in R, Analyze in SAS!
Looking for a SAS-R integration example that uses the best of both worlds? I show [...]
Dec
Dumbbell Plot for Comparison of Rated Items: Which is Rated More Highly – Harvard or the U of MN?
Want to compare multiple rankings on two competing items – like hotels, restaurants, or colleges? [...]
2 Comments
Sep
Data for Meta-analysis Need to be Prepared a Certain Way – Here’s How
Getting data for meta-analysis together can be challenging, so I walk you through the simple [...]
Jul

Sort Order, Formats, and Operators: A Tour of The SAS Documentation Page
Get to know three of my favorite SAS documentation pages: the one with sort order, [...]
Nov
Confused when Downloading BRFSS Data? Here is a Guide
I use the datasets from the Behavioral Risk Factor Surveillance Survey (BRFSS) to demonstrate in [...]
2 Comments
Oct
Doing Surveys? Try my R Likert Plot Data Hack!
I love the Likert package in R, and use it often to visualize data. The [...]
3 Comments
Oct
I Used the R Package EpiCurve to Make an Epidemiologic Curve. Here’s How It Turned Out.
With all this talk about “flattening the curve” of the coronavirus, I thought I would [...]
Mar
Which Independent Variables Belong in a Regression Equation? We Don’t All Agree, But Here’s What I Do.
Trying to decide what independent variables belong in a regression can be daunting. My blog [...]
Aug
Prevent research misconduct, and the consequences and drama that goes with it. Use some simple, practical strategies I describe in my blog post.
