

Problems with PRISMA is a topic I hardly see talked or written about, even though the use of PRISMA has generated a lot of trouble in the recent scientific literature. PRISMA stands for Preferred Reporting Items for Systematic Reviews and Meta-Analyses, and refers to a set of standards that should be used when conducting a systematic review or meta-analysis, then publishing a report on it. PRISMA itself is not a bad thing, and the problems with PRISMA are not really PRISMA’s fault – they are with the inappropriate application of PRISMA.

The original intention of PRISMA was to provide guidance to epidemiologists like myself, who endeavor to write a review with the aim of synthesizing numerical results from high quality, large sample studies. A traditional scenario that is optimal for a PRISMA-style review is where a drug that treats a certain condition has been tested in the context of many different randomized controlled trials (RCTs), all of which report different effect sizes as results. Using PRISMA, appropriate RCTs can be selected for inclusion in the review, and their numerical results combined so that we can see at the end of the day what the overall effect is of this drug. If you are using PRISMA for that, I have no problems with PRISMA.
There is another scenario where PRISMA is also helpful, and that’s when a certain exposure (such as being exposed to pesticides as part of your job) is studied for its potentially harmful or protective effects (such as giving you cancer) over and over in different samples. This would be a longitudinal cohort study design, which is observational (not an RCT). Again, each study would calculate a different effect size, and so how do you put them all together and see what the overall effect of the exposure is on the resulting condition? PRISMA to the rescue. Again, in this case, I have no problems with PRISMA being used.
In fact, I am first author of a systematic review like that published in 2009, where our research team examined whether a woman being pregnant changed her metabolism in such a way that it granted her protection from pancreatic cancer (spoiler: it didn’t). I didn’t use PRISMA for this because the first version of PRISMA was published the same year, but had it been around at the time we did the review, we could have applied the standards, and would have had no problems with PRISMA.
Problems with PRISMA: So What’s Wrong with it?
The problem comes with applying PRISMA to do a review in any other situation. Starting about 10 years ago, I was surprised to start seeing PRISMA reviews that included articles on studies that were not biomedical in nature. These articles did not report RCTs or cohort studies. They often reported cross-sectional studies, which are a relatively weak form of evidence (with respect to the evidence-based medicine framework), as I will depict in a figure below.
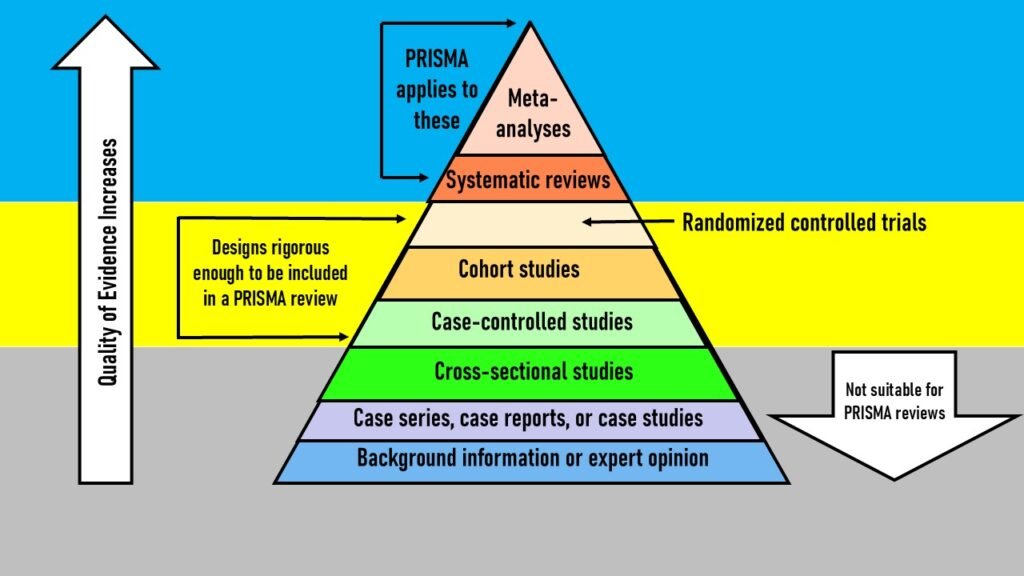
As you can see by the graphic above, most study designs are not rigorous enough to be included in a PRISMA review. I’m not sure why, but the organization that developed PRISMA actually started promoting the use of low-rigor study designs in PRISMA reviews about 10 years ago. Next, researchers actually started doing PRISMA reviews with low-rigor study designs, and professors began encouraging students to create and publish PRISMA reviews with low-rigor study designs. So what was the result of all this?

The Scientific Literature Explodes with Useless PRISMA Reviews
As you can probably guess, if you use a screwdriver to do something that requires a hammer, you will not get good results. So if you try to apply PRISMA to low-rigor study designs, you are going to get a bunch of crappy review papers.
Take, for example, this systematic review of the impact of social support on college students’ wellbeing and mental health. “Social support” is not a drug or a biological exposure, and “wellbeing and mental health” is not a specific condition. How can a study like this combine effect sizes from different studies when the studies are going to measure these latent variables so differently?
If you download the paper, you will see the PDF is 20 pages long, but the results are only on pages 7 through 12. What’s before that is mostly methods, which is boring in this context. Most of the methods in PRISMA have to do with assessing the quality of the rigor of the included studies – which is already low if they are not RCTs or cohort studies, which is the case in this and many other recent PRISMA reviews.
The article says that numerical results could not be synthesized because of the diversity of study designs and measurements across the 51 studies they included. Obviously! So the article instead tallies the years in which they were published (with several years having only one study published), the countries where the studies were conducted (with seven countries only contributing one study), and the various instruments used for measuring wellbeing and social support. The authors are left with reporting on three topics they call “themes” across the studies: instruments used to measure wellbeing and social support, direct effects of social support on wellbeing, and indirect effects of social support on wellbeing.
I am not picking on these authors – all the PRISMA-style articles including low-rigor studies read like this. They take a collection of articles that meet some qualification criteria, and try to find some similarities across them. The result is an article of no use to the scientific literature. As a scientific author, I cannot cite this article for any reason, because it does not report any findings relevant to science. So why do so many of these articles exist and clutter up the scientific literature?
Why Useless PRISMA Reviews are Published
The answer is simple. Authors write them just so they can say they have a publication. After all, they don’t have to go through the trouble of actually doing a study themselves. They can just come up with some topic, get a bunch of articles on the topic, put them through the PRISMA machine, and viola! A publishable paper. The journals accept them because PRISMA is considered a scientifically rigorous way of doing reviews. So the journal gets its publication fee, and the authors get another publication for their CVs.
So Should We Stop Doing Review Papers?
Absolutely not! In fact, I would argue that these same authors could have done a different type of review of the 51 studies they included that would have produced knowledge that was useful to the body of scientific literature, and would have been citable.
The point of this blog post is to enlighten you to the fact that there are other types of reviews that can be done that are not PRISMA reviews, and are more suitable for topics like social support and wellbeing. Because there is a diversity of nomenclature in naming these different review styles, I will refer to this paper, which provides guidance on what types of reviews exist and how they are done.
I will highlight a few types of reviews the authors talk about in this paper that would have been better alternatives to PRISMA for summarizing studies that are low on the evidence-based medicine pyramid. Rather than talking about review styles, they collect similar review styles into what they call “families” of reviews, several of which I will talk about here.
Traditional Reviews Family
These are reviews that summarize the literature after applying purposive sampling, which means setting qualification criteria and making sure all the articles included in the review meet those criteria. While this happens in PRISMA, PRISMA requires a lot of other processes that are not required of traditional reviews.
In one type of traditional review which I find particularly useful, the articles are summarized using a narrative review approach. Examples I have co-authored include one on periodontitis in Saudi Arabia, and one on deeper learning methods and modalities in higher education.
This approach would have probably been more useful for the social support and wellbeing/mental health review I mentioned earlier. Using a traditional narrative review, the authors could have still sampled the 51 studies they used, but they would not have had to spend a lot of extra real estate on explaining their methodology. Instead, they could have dug more into what the articles actually said. They might have grouped the articles by similarities in their study designs, and then summarized what those groups of articles found. In any case, an alternative review approach could have freed the authors to generate and present true higher-level knowledge from considering what the articles said collectively.

Purpose-specific Reviews Family
To explain this family of reviews, it’s best that I quote the authors:
The purpose-specific review family is the most difficult to characterize largely because of the heterogeneity of review types and methods. All review types should be selected appropriately according to purpose; however, by “purpose-specific” we imply that the degree of tailoring required to meet a specific single purpose is such that it makes it more challenging to adapt the review type for generic use beyond that purpose.
The authors give the example of a health technology assessment, where specific questions need to be answered as part of the review. Scoping reviews fall under this family.
Systematic Reviews Family
These are where the PRISMA reviews fall, but the paper points out there are other standards that can be followed for systematic reviews.
Rapid Reviews Family
You may have seen “rapid review” in the title of some reviews. The authors describe this family of reviews this way:
All rapid reviews should involve detailed negotiation between the review team and the client/customer regarding the scope and methods to establish how they will be delivered within the time available; this negotiation is the defining feature of this family.
How I read this is that every “rapid review” published is based on a negotiation between the authors and the journal as to how and what the authors cover. Indeed, it has been my experience that journals often reach out to authors known to be experts in their field and ask them to undertake a rapid review on an emerging topic.
Qualitative Systematic Reviews Family
These are reviews of qualitative studies. While it is certainly acceptable to write a review of qualitative studies, I strongly caution against engaging in a qualitative evidence synthesis (QES), which is one type of review in this family. This is because qualitative studies are not designed to be synthesized together like quantitative studies; they are meant to be unique and connected directly to their original context, and the QES violates this standard by employing an approach parallel to combining numerical estimates as is done in a meta-analysis.
Are There Other Review Approaches Not Mentioned Here?
Yes! There are many different ways to approach reviewing a body of literature. I encourage you to read the original article to which I’m referring. If you do that, you will find that even though the article does a good job of summarizing the types of reviews out there, it takes care to point out that there is a diversity in the language used around these different types of reviews, and unlike PRISMA, many do not have well-established processes and standards.
My overall point is to avoid using PRISMA to guide your review unless your research question can be answered by filtering in RCTs or cohort studies on the topic, and is aimed at estimating an overall effect size. If the types of studies you want to include in your review have a low level of rigor, instead, consider an alternative approach, such as a traditional narrative review with purposive sampling, or one of the other review types mentioned in the article I cited.
Read all of our data science blog posts!

Problems with PRISMA: Why it Sucks, and What You Should Do About It
Problems with PRISMA? You’re not the only one. The PRISMA framework does not work well [...]
Oct

Prevent Research Misconduct, and Avoid the Drama
Prevent research misconduct, and the consequences and drama that goes with it. Use some simple, [...]
Oct

Mixed Methods Research: The Hot New Trend in Graduate School
Mixed methods research is trending now, with doctoral students and academics being pressured to do [...]
Oct

AI or Statistics – Which Modeling Approach Should You Use?
AI or statistics – two different, interrelated approaches you can use in your scientific publication. [...]
Sep
Confidence Intervals are for Estimating a Range for the True Population-level Measure
Confidence intervals (CIs) help you get a solid estimate for the true population measure. Read [...]
1 Comment
Jun
Continuous Variable? You Can Categorize it!
Continuous variable categorized can open up a world of possibilities for analysis. Read about it [...]
2 Comments
Jun
Delete if the Row Meets Criteria? Do it in SAS!
Delete if rows meet a certain criteria is a common approach to paring down a [...]
May

Chi-square Test: Insight from Using Microsoft Excel
Chi-square test is hard to grasp – but doing it in Microsoft Excel can give [...]
May
Identify Elements of Research in Scientific Literature
Identify elements in research reports, and you’ll be able to understand them much more easily. [...]
May
Design the Most Useful Time Periods for Your Conversions
Time periods are important when creating a time series visualization that actually speaks to you! [...]
Apr
Apply Weights? It’s Easy in R with the Survey Package!
Apply weights to get weighted proportions and counts! Read my blog post to learn how [...]
Nov
Make Categorical Variable Out of Continuous Variable
Make categorical variables by cutting up continuous ones. But where to put the boundaries? Get [...]
Nov
Remove Rows in R with the Subset Command
Remove rows by criteria is a common ETL operation – and my blog post shows [...]
Oct

CDC Wonder for Studying Vaccine Adverse Events: The Shameful State of US Open Government Data
CDC Wonder is an online query portal that serves as a gateway to many government [...]
Jun

AI Careers: Riding the Bubble
AI careers are not easy to navigate. Read my blog post for foolproof advice for [...]
Jun

Descriptive Analysis of Black Friday Death Count Database: Creative Classification
Descriptive analysis of Black Friday Death Count Database provides an example of how creative classification [...]
Nov
Classification Crosswalks: Strategies in Data Transformation
Classification crosswalks are easy to make, and can help you reduce cardinality in categorical variables, [...]
Nov

FAERS Data: Getting Creative with an Adverse Event Surveillance Dashboard
FAERS data are like any post-market surveillance pharmacy data – notoriously messy. But if you [...]
4 Comments
Nov
Dataset Source Documentation: Necessary for Data Science Projects with Multiple Data Sources
Dataset source documentation is good to keep when you are doing an analysis with data [...]
Nov

Joins in Base R: Alternative to SQL-like dplyr
Joins in base R must be executed properly or you will lose data. Read my [...]
Nov

NHANES Data: Pitfalls, Pranks, Possibilities, and Practical Advice
NHANES data piqued your interest? It’s not all sunshine and roses. Read my blog post [...]
Nov

Color in Visualizations: Using it to its Full Communicative Advantage
Color in visualizations of data curation and other data science documentation can be used to [...]
Oct

Defaults in PowerPoint: Setting Them Up for Data Visualizations
Defaults in PowerPoint are set up for slides – not data visualizations. Read my blog [...]
Oct
Text and Arrows in Dataviz Can Greatly Improve Understanding
Text and arrows in dataviz, if used wisely, can help your audience understand something very [...]
Oct
Shapes and Images in Dataviz: Making Choices for Optimal Communication
Shapes and images in dataviz, if chosen wisely, can greatly enhance the communicative value of [...]
Oct

Table Editing in R is Easy! Here Are a Few Tricks…
Table editing in R is easier than in SAS, because you can refer to columns, [...]
Aug
R for Logistic Regression: Example from Epidemiology and Biostatistics
R for logistic regression in health data analytics is a reasonable choice, if you know [...]
272 Comments
Aug

Connecting SAS to Other Applications: Different Strategies
Connecting SAS to other applications is often necessary, and there are many ways to do [...]
Jul

Portfolio Project Examples for Independent Data Science Projects
Portfolio project examples are sometimes needed for newbies in data science who are looking to [...]
Jul

Project Management Terminology for Public Health Data Scientists
Project management terminology is often used around epidemiologists, biostatisticians, and health data scientists, and it’s [...]
Jun

Rapid Application Development Public Health Style
“Rapid application development” (RAD) refers to an approach to designing and developing computer applications. In [...]
Jun

Understanding Legacy Data in a Relational World
Understanding legacy data is necessary if you want to analyze datasets that are extracted from [...]
Jun
Front-end Decisions Impact Back-end Data (and Your Data Science Experience!)
Front-end decisions are made when applications are designed. They are even made when you design [...]
Jun

Reducing Query Cost (and Making Better Use of Your Time)
Reducing query cost is especially important in SAS – but do you know how to [...]
Jun

Curated Datasets: Great for Data Science Portfolio Projects!
Curated datasets are useful to know about if you want to do a data science [...]
May
Statistics Trivia for Data Scientists
Statistics trivia for data scientists will refresh your memory from the courses you’ve taken – [...]
Apr

Management Tips for Data Scientists
Management tips for data scientists can be used by anyone – at work and in [...]
Mar
REDCap Mess: How it Got There, and How to Clean it Up
REDCap mess happens often in research shops, and it’s an analysis showstopper! Read my blog [...]
Mar

GitHub Beginners in Data Science: Here’s an Easy Way to Start!
GitHub beginners – even in data science – often feel intimidated when starting their GitHub [...]
Feb
ETL Pipeline Documentation: Here are my Tips and Tricks!
ETL pipeline documentation is great for team communication as well as data stewardship! Read my [...]
Feb
Benchmarking Runtime is Different in SAS Compared to Other Programs
Benchmarking runtime is different in SAS compared to other programs, where you have to request [...]
Dec

End-to-End AI Pipelines: Can Academics Be Taught How to Do Them?
End-to-end AI pipelines are being created routinely in industry, and one complaint is that academics [...]
Nov
Referring to Columns in R by Name Rather than Number has Pros and Cons
Referring to columns in R can be done using both number and field name syntax. [...]
Oct
The Paste Command in R is Great for Labels on Plots and Reports
The paste command in R is used to concatenate strings. You can leverage the paste [...]
Oct
Coloring Plots in R using Hexadecimal Codes Makes Them Fabulous!
Recoloring plots in R? Want to learn how to use an image to inspire R [...]
5 Comments
Oct
Adding Error Bars to ggplot2 Plots Can be Made Easy Through Dataframe Structure
Adding error bars to ggplot2 in R plots is easiest if you include the width [...]
Oct

AI on the Edge: What it is, and Data Storage Challenges it Poses
“AI on the edge” was a new term for me that I learned from Marc [...]
Jun

Pie Chart ggplot Style is Surprisingly Hard! Here’s How I Did it
Pie chart ggplot style is surprisingly hard to make, mainly because ggplot2 did not give [...]
5 Comments
Apr
Time Series Plots in R Using ggplot2 Are Ultimately Customizable
Time series plots in R are totally customizable using the ggplot2 package, and can come [...]
Apr

Data Curation Solution to Confusing Options in R Package UpSetR
Data curation solution that I posted recently with my blog post showing how to do [...]
Apr

Making Upset Plots with R Package UpSetR Helps Visualize Patterns of Attributes
Making upset plots with R package UpSetR is an easy way to visualize patterns of [...]
11 Comments
Apr
Making Box Plots Different Ways is Easy in R!
Making box plots in R affords you many different approaches and features. My blog post [...]
Mar
Convert CSV to RDS When Using R for Easier Data Handling
Convert CSV to RDS is what you want to do if you are working with [...]
Mar

GPower Case Example Shows How to Calculate and Document Sample Size
GPower case example shows a use-case where we needed to select an outcome measure for [...]
Feb
Querying the GHDx Database: Demonstration and Review of Application
Querying the GHDx database is challenging because of its difficult user interface, but mastering it [...]
Feb
Variable Names in SAS and R Have Different Restrictions and Rules
Variable names in SAS and R are subject to different “rules and regulations”, and these [...]
Feb
Referring to Variables in Processing Data is Different in SAS Compared to R
Referring to variables in processing is different conceptually when thinking about SAS compared to R. [...]
Jan
Counting Rows in SAS and R Use Totally Different Strategies
Counting rows in SAS and R is approached differently, because the two programs process data [...]
Jan

Native Formats in SAS and R for Data Are Different: Here’s How!
Native formats in SAS and R of data objects have different qualities – and there [...]
Jan

SAS-R Integration Example: Transform in R, Analyze in SAS!
Looking for a SAS-R integration example that uses the best of both worlds? I show [...]
Dec
Dumbbell Plot for Comparison of Rated Items: Which is Rated More Highly – Harvard or the U of MN?
Want to compare multiple rankings on two competing items – like hotels, restaurants, or colleges? [...]
2 Comments
Sep
Data for Meta-analysis Need to be Prepared a Certain Way – Here’s How
Getting data for meta-analysis together can be challenging, so I walk you through the simple [...]
Jul

Sort Order, Formats, and Operators: A Tour of The SAS Documentation Page
Get to know three of my favorite SAS documentation pages: the one with sort order, [...]
Nov
Confused when Downloading BRFSS Data? Here is a Guide
I use the datasets from the Behavioral Risk Factor Surveillance Survey (BRFSS) to demonstrate in [...]
2 Comments
Oct
Doing Surveys? Try my R Likert Plot Data Hack!
I love the Likert package in R, and use it often to visualize data. The [...]
3 Comments
Oct
I Used the R Package EpiCurve to Make an Epidemiologic Curve. Here’s How It Turned Out.
With all this talk about “flattening the curve” of the coronavirus, I thought I would [...]
Mar
Which Independent Variables Belong in a Regression Equation? We Don’t All Agree, But Here’s What I Do.
Trying to decide what independent variables belong in a regression can be daunting. My blog [...]
Aug
Problems with PRISMA? You’re not the only one. The PRISMA framework does not work well for most reviews. Read my blog post to learn what you should do instead.
