FAERS data are like any post-market surveillance pharmacy data – notoriously messy. But if you apply strong study design skills and a scientific approach, you can use the FAERS online dashboard to obtain a dataset and develop an enlightening portfolio project. I show you how in my blog post!
Tag Archives: drug poilicy
Defaults in PowerPoint are set up for slides – not data visualizations. Read my blog post for tips on reconfiguring PowerPoint to make it easy for dataviz!
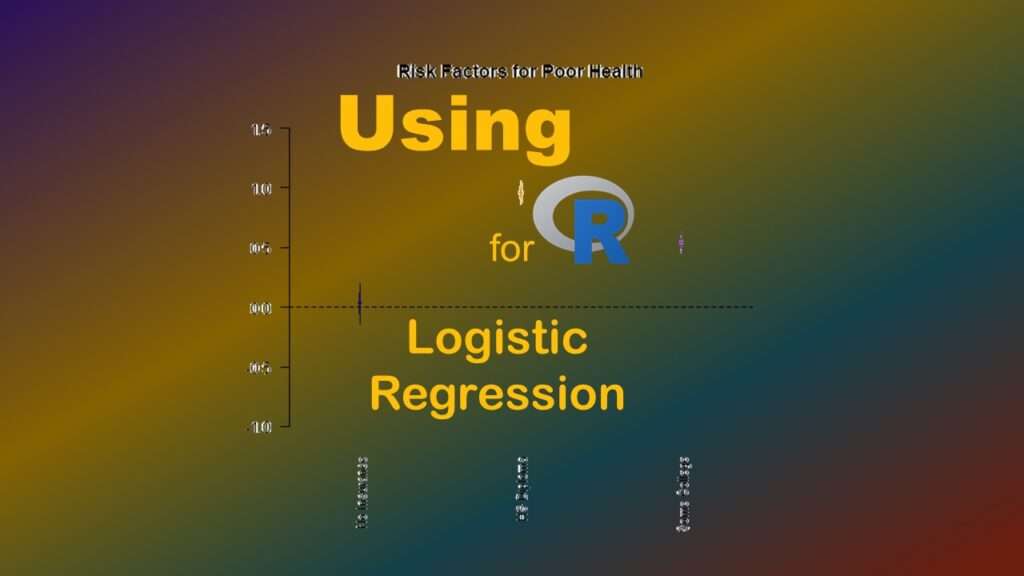
R for logistic regression in health data analytics is a reasonable choice, if you know what packages to use. You don’t have to use SAS! My blog post provides you example R code and a tutorial!
The paste command in R is used to concatenate strings. You can leverage the paste command to make refreshable label objects for reports and plots, as I describe in my blog post.
Can you name categories other than “food” and “drugs” that are regulated by the FDA in the US? Read this blog post to learn what they are, and what the FDA does in the US.


