A/B testing seems straightforward, but there are a lot of picky details. What A and B conditions do you actually test? How long do you run the test? How do you calculate the statistics for the test? Answer your questions by taking this LinkedIn Learning course.
Monthly Archives: October 2020
SAS is known for big data and data warehousing, but how do you actually design and build a SAS data warehouse or data lake? What datasets do you include? How do you transform them? How do you serve warehouse users? How do you manage your developers? This book has your answers!
Curation files are especially helpful for communicating about data on teams. Learn more about what you’ll learn when you take my online LinkedIn Learning data curation course!
I use the datasets from the Behavioral Risk Factor Surveillance Survey (BRFSS) to demonstrate in a lot of my data science tutorials. The BRFSS are free and available to the public – but they are kind of buried on the web site. This blog post serves as a “map” to help you find them!
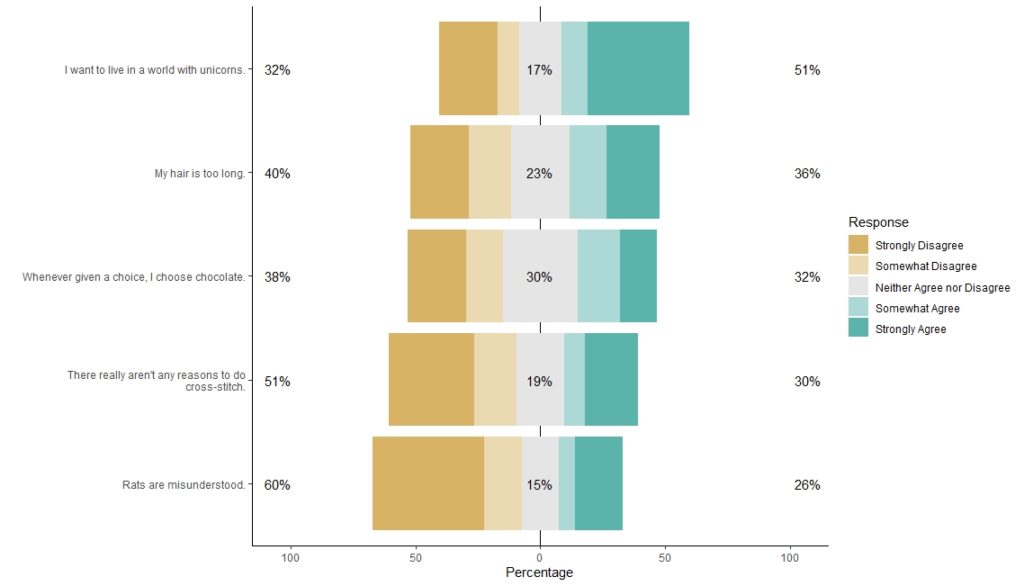
I love the Likert package in R, and use it often to visualize data. The problem is that sometimes, I have sparse data, and this can cause problems with the package. This blog post shows you a workaround, and also, a way to format the final plot that I think looks really great!


