Defaults in PowerPoint are set up for slides – not data visualizations. Read my blog post for tips on reconfiguring PowerPoint to make it easy for dataviz!
Tag Archives: online data portal
The paste command in R is used to concatenate strings. You can leverage the paste command to make refreshable label objects for reports and plots, as I describe in my blog post.
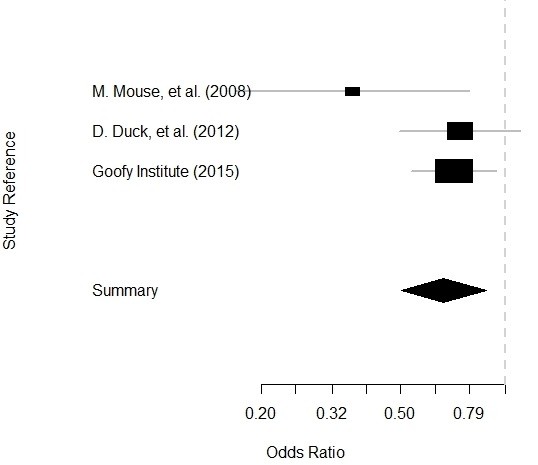
Getting data for meta-analysis together can be challenging, so I walk you through the simple steps I take, starting with the scientific literature, and ending with a gorgeous and evidence-based Forrest plot!
I use the datasets from the Behavioral Risk Factor Surveillance Survey (BRFSS) to demonstrate in a lot of my data science tutorials. The BRFSS are free and available to the public – but they are kind of buried on the web site. This blog post serves as a “map” to help you find them!


