Counting rows in SAS and R is approached differently, because the two programs process data in different ways. Read my blog post where I describe both ways.
Tag Archives: data interpretation
07
Jan
Jan
Native formats in SAS and R of data objects have different qualities – and there are reasons behind these differences. Learn about them in this blog post!
11
Oct
Oct
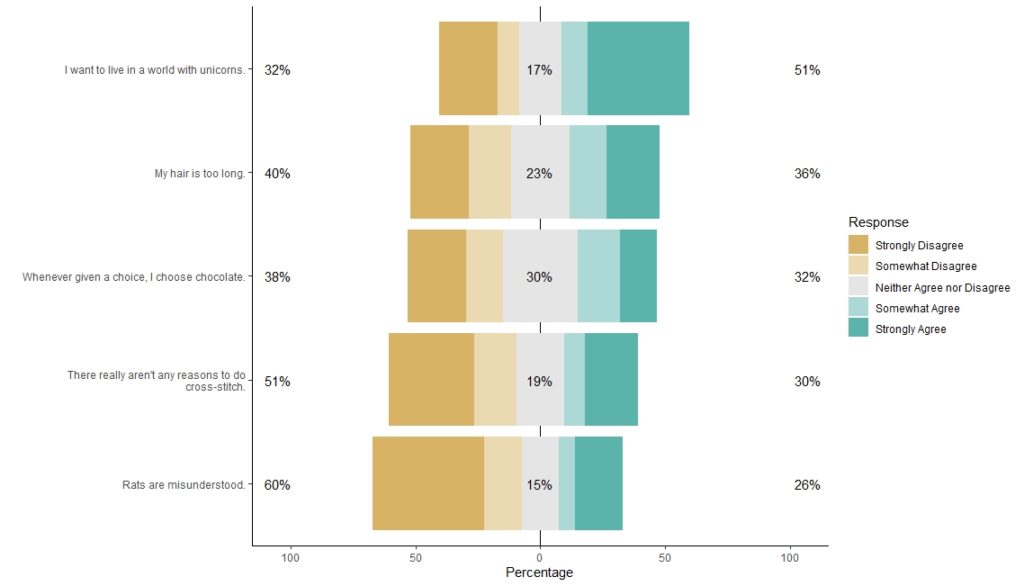
I love the Likert package in R, and use it often to visualize data. The problem is that sometimes, I have sparse data, and this can cause problems with the package. This blog post shows you a workaround, and also, a way to format the final plot that I think looks really great!
- 1
- 2