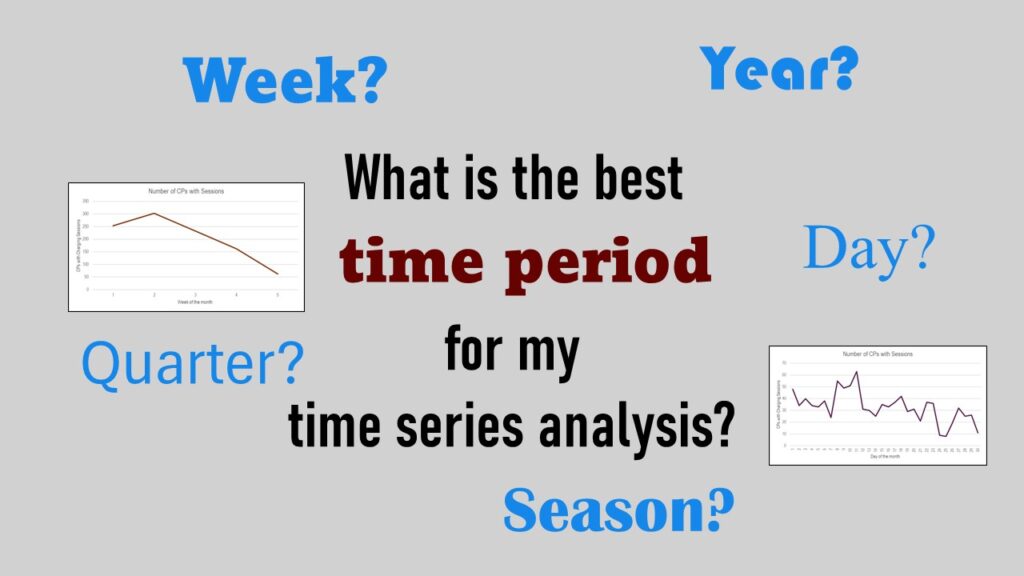
Time periods are important when creating a time series visualization that actually speaks to you! Get advice on my blog.
Tag Archives: visualizations of time-dependent variables

11
Apr
Apr
Time series plots in R are totally customizable using the ggplot2 package, and can come out with a look that is clean and sharp. However, you usually end up fighting with formatting the x-axis and other options, and I explain in my blog post.