
This lively panel discussed many topics around designing and implementing machine learning pipelines. Two main issues were identified. The first is that you really have to take some time to do exploratory research and define the problem. The second is that you need to also understand the business rules and context behind the data.
Tag Archives: study design
Educational Resources
If You Want to Increase Conversions, Try my A/B Testing Course on LinkedIn Learning

26
Oct
Oct
A/B testing seems straightforward, but there are a lot of picky details. What A and B conditions do you actually test? How long do you run the test? How do you calculate the statistics for the test? Answer your questions by taking this LinkedIn Learning course.
14
Oct
Oct
I use the datasets from the Behavioral Risk Factor Surveillance Survey (BRFSS) to demonstrate in a lot of my data science tutorials. The BRFSS are free and available to the public – but they are kind of buried on the web site. This blog post serves as a “map” to help you find them!
14
Mar
Mar
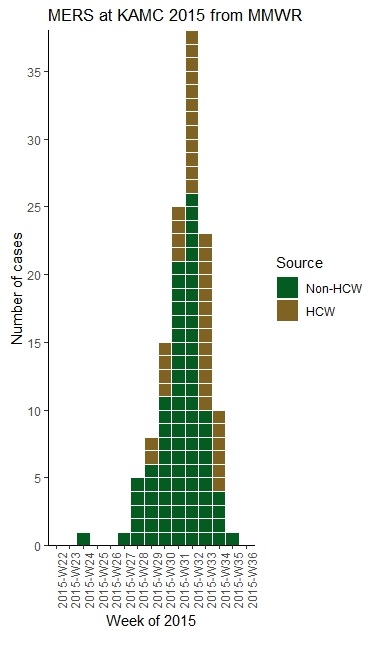
With all this talk about “flattening the curve” of the coronavirus, I thought I would get into the weeds about what curve we are talking about when we say that. We are talking about what’s called an epidemiologic curve, or epicurve for short. And to demonstrate what an epicurve is and what it means, I […]
- 1
- 2