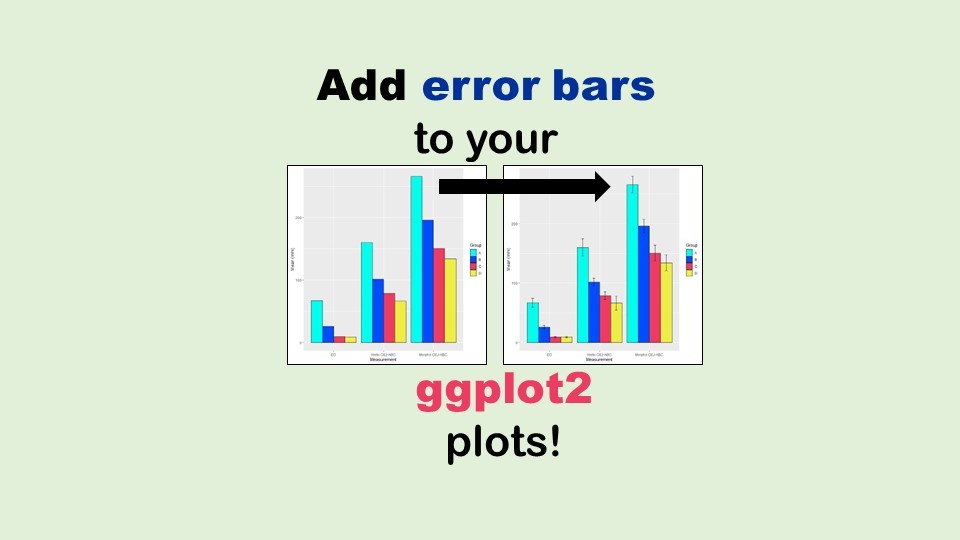
Adding error bars to ggplot2 in R plots is easiest if you include the width of the error bar as a variable in your plot data. Read my blog post to see an example.
Tag Archives: data stewardshiip
“What is the ONC?” is what I used to ask before I realized it involves health technology. Although ONC just means “Office of the National Coordinator”, this agency is now known as HealthIT.gov, as I explain in my blog post.
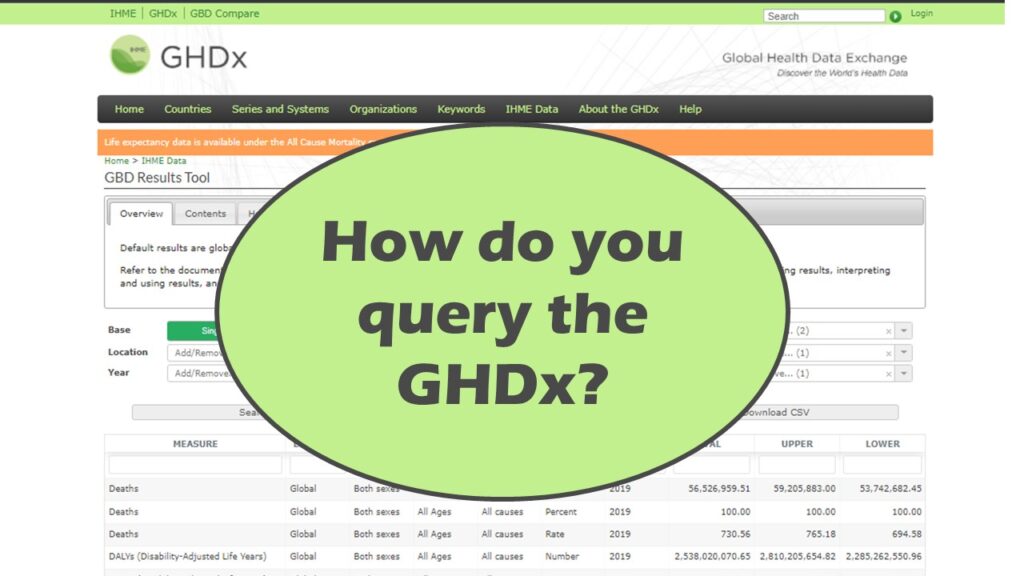
Querying the GHDx database is challenging because of its difficult user interface, but mastering it will allow you to access country-level health data for comparisons! See my demonstration!
As a data science leader, what should you put in place so your organization doesn’t end up a data mess like startup Theranos? This blog posts provides guidance.


