R for logistic regression in health data analytics is a reasonable choice, if you know what packages to use. You don’t have to use SAS! My blog post provides you example R code and a tutorial!
Tag Archives: Drug War
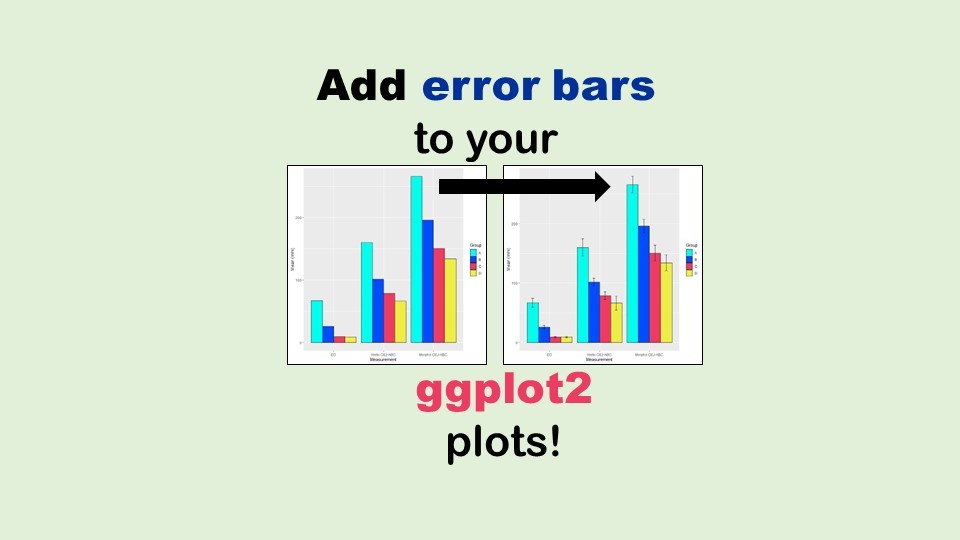
Adding error bars to ggplot2 in R plots is easiest if you include the width of the error bar as a variable in your plot data. Read my blog post to see an example.
Can you name categories other than “food” and “drugs” that are regulated by the FDA in the US? Read this blog post to learn what they are, and what the FDA does in the US.


