Tag Archives: using shapes for concepts

Confidence Intervals are for Estimating a Range for the True Population-level Measure

Many people find calculating confidence intervals easy - but how do you interpret them?

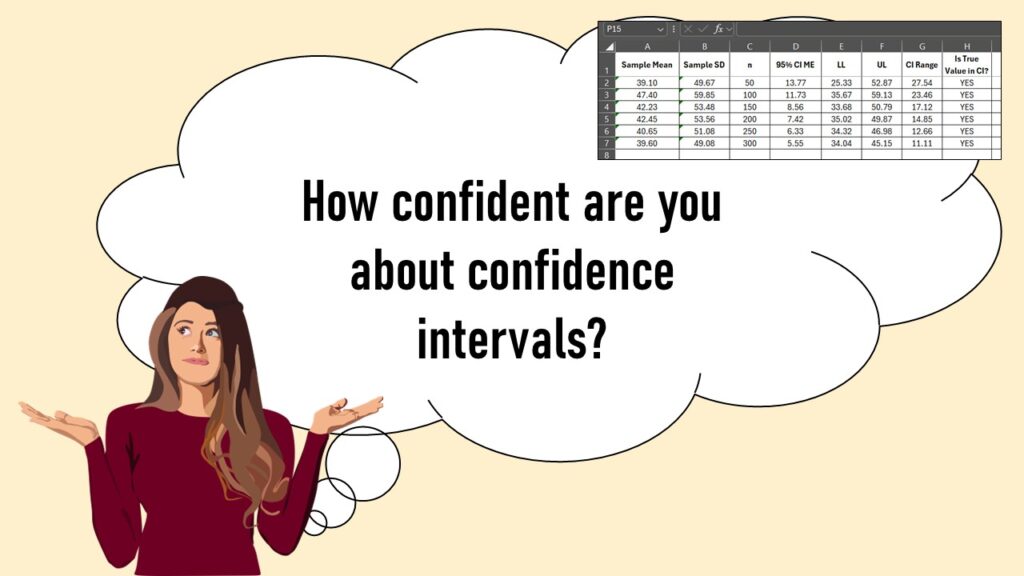
Confidence intervals (CIs) help you get a solid estimate for the true population measure. Read my blog and try my CI calculator!

Shapes and Images in Dataviz: Making Choices for Optimal Communication

If you use good judgment in choosing chapes and images to add to your data visualizations, your audience will be enlightened.

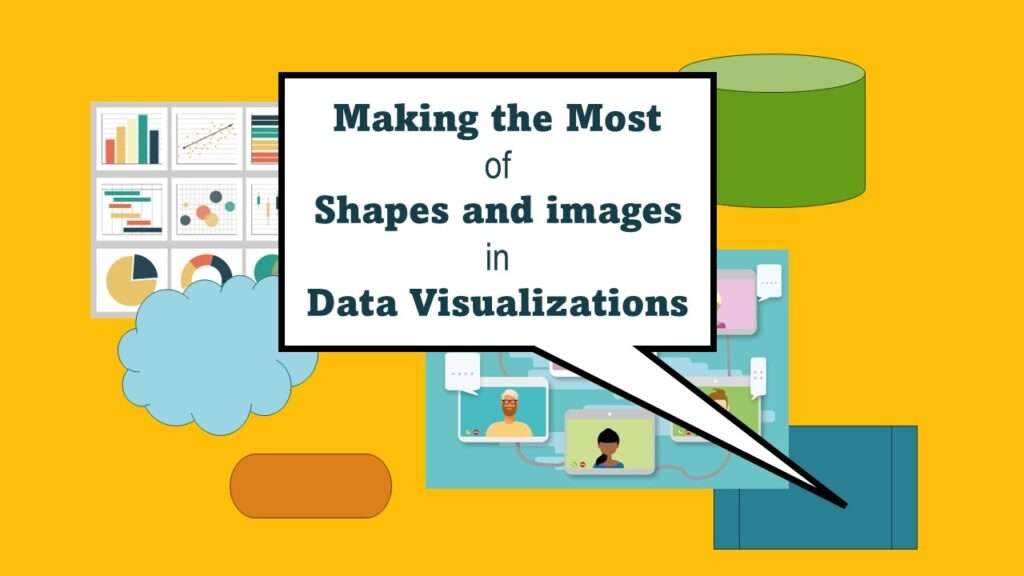
Shapes and images in dataviz, if chosen wisely, can greatly enhance the communicative value of the visualization. Read my blog post for tips in selecting shapes for data visualizations!

Verified by MonsterInsights