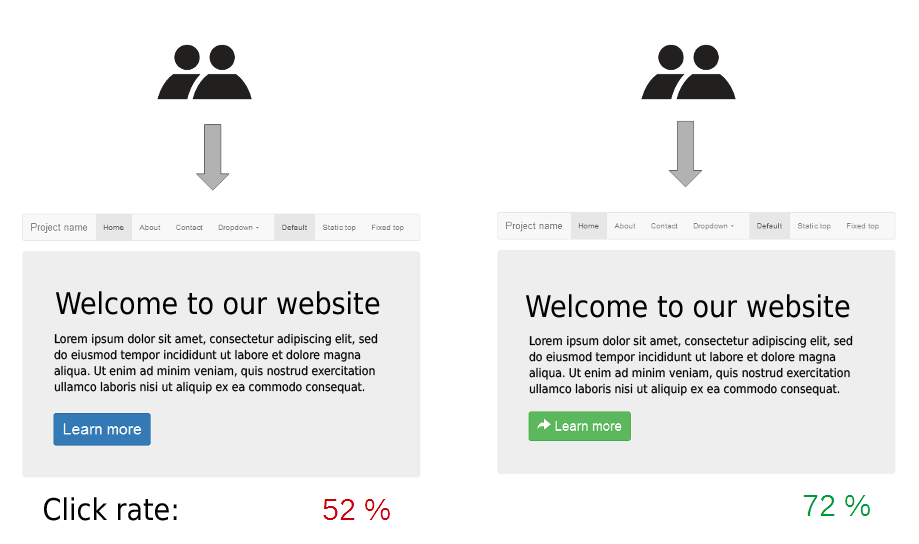
In May 2020, LinkedIn Learning released my new A/B testing course, the Data Science of Experimental Design. If you want an experimental scientist to teach you how to do a whole experiment online and actually do the statistics properly so you can gain insight, you want to take this A/B testing course.

Chapter 1: Introduction to Experimental Testing
I’ve noticed that the two main things people get wrong when designing A/B testing is the design of the A and B conditions, and in how they do the statistics on the data they gather. Therefore, in this A/B testing course, I really focus on study design, measurement, analytics, and doing a good interpretation so your results are actionable. We cover:
- Study design features of experiments
- Appropriate and inappropriate roles and settings for experiments, and
- What conditions are and how to specify them
We take deep dives into other topics in the rest of the course.

Chapter 2: Defining Conversions
Topics covered: What a conversion is, and how to choose or define one.
What you learn how to do: Consider the different nuances and subtle details associated with defining conversions. This includes thinking of different types of conversions, weighing their priorities, and thinking about appropriate time periods for measuring them.

Chapter 3: Defining Conversion Rates
Topics covered: What a conversion rate actually is, and how it can you plan your marketing campaigns.
What you learn how to do: Conversions are just numerators for conversion rates. But for each conversion, what is the right denominator for the conversion rate? We go over all the details behind making these choices, including measurement issues, false positives and negatives, and thinking of time frames.

Chapter 4: Baseline Descriptive Analysis
Topics covered: Creating time-series charts and using them to guide decisions about conversions, conversion rates, and campaigns.
What you learn how to do: Structure the data you are getting from your project in a way that you can do a time-series plot and see what is going on. Also, we talk about strategies to increase conversions without even doing an experiment, and ways to plan to keep benchmarking success during a campaign.

Chapter 5: Designing the Experiment
Topics covered: One theme of this course is that many people who think they need an experiment actually just need to do some baseline descriptive analysis. But if you make it to Chapter 5 and you really need to do an experiment, here is where we talk about the actual study design behind the experiment.
What you learn how to do: Assuming your baseline condition is one of your conditions, you design the other condition, test the implementation, and practice using the chi-squared test statistic in Excel so you can get ready to analyze your real data when it comes out of the experiment.

Chapter 6: Sample Size and Statistics
Topics covered: In order to figure out how long to run your experiment, you need to do a sample size estimate, and we go over how to do that.
What you learn how to do: I show how to do a simulation in Excel to estimate how long you will have to do the experiment to get enough sample. As a bonus, I also show you how to use G*Power, my favorite sample size calculator!

Chapter 7: Analyzing and Interpreting Data
Topics covered: Using Excel to analyze our structured data from our experiment.
What you learn how to do: Updating your time-series analysis to include data from your experimental condition, along with using your chi-squared analysis, and interpreting your results.

Chapter 8: Conclusion
For my LinkedIn Learning courses, including this A/B testing course, I get criticized for having long conclusions. I’m just big on making your results actionable. The take home message from this section is to write a report with your results. It doesn’t have to be long, but if it doesn’t get written down, your findings and knowledge will probably be lost to history.
Published October 26, 2020. Fixed typo on October 31, 2020. Photograph of Condensation Cube by Hans Haacke, available here. Added FTC verbiage December 5, 2020. Formatting changes added January 13, 2022.
A/B testing seems straightforward, but there are a lot of picky details. What A and B conditions do you actually test? How long do you run the test? How do you calculate the statistics for the test? Answer your questions by taking this LinkedIn Learning course.


